日本語

Ask in words. Get a clean diagram.

svg-diagram is a diagram server that Claude and ChatGPT can call. It draws 72 kinds of figures, from business processes and problem solving to strategy, planning and idea maps, and checks each one for overlaps and text that does not fit. Try the prompts below as they are.

How to connect
  1. In Claude (desktop or claude.ai) or ChatGPT, add a custom MCP server (connector) with the URL /mcp. The first time, you sign in with your Google account (only its account id and email address are received).
  2. In ChatGPT, pick svg-diagram with "@" or "+" when you send a message.
  3. In Claude, turn svg-diagram on under "+" → "Connectors". To make sure it is used, set its tool access to "Always available".
  4. Saying "using svg-diagram" in the prompt helps the assistant call this server instead of drawing the figure itself.
Make slides (PowerPoint)

Example prompt: Using svg-diagram, make 3 slides for a briefing from the figures so far. Give each slide a heading and a one-line point, and put what to say in the speaker notes.

Processes and systems

How work moves along, and how a system fits together.

Steps and branches

Flowchart

Steps and decisions (diamonds) joined by arrows, to show where a procedure branches. The arrows out of a decision carry Yes / No.
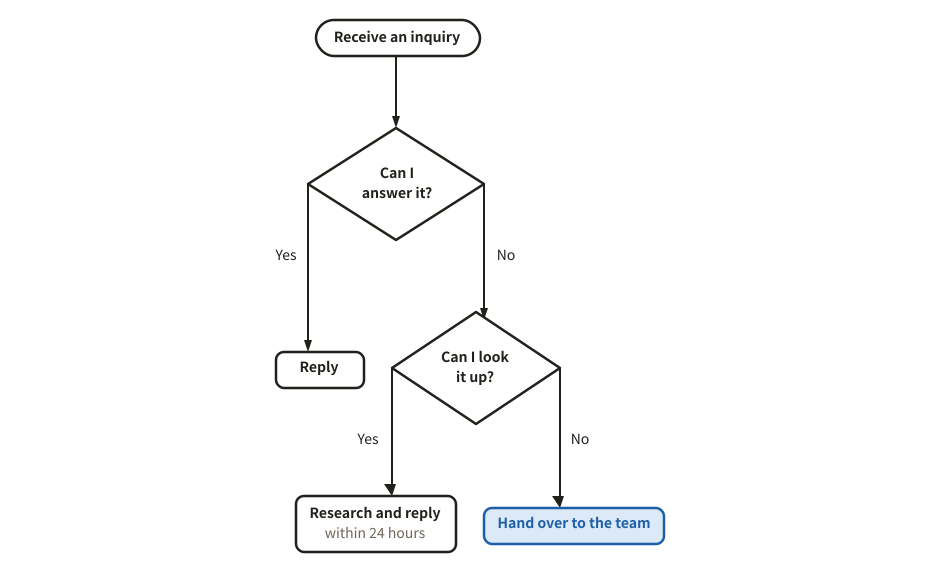
Example of a flowchart
Example prompt

Using svg-diagram, draw a flowchart of how we handle a support inquiry. Branch on whether I can answer it myself and whether I can find the answer.

JSON (the figure as the tool receives it)
{
  "version": 1,
  "title": "Handling an inquiry",
  "parts": [
    {
      "type": "flowchart",
      "nodes": [
        {
          "id": "start",
          "kind": "terminator",
          "label": "Receive an inquiry"
        },
        {
          "id": "q1",
          "kind": "decision",
          "label": "Can I answer it?"
        },
        {
          "id": "a1",
          "label": "Reply"
        },
        {
          "id": "q2",
          "kind": "decision",
          "label": "Can I look it up?"
        },
        {
          "id": "a2",
          "label": "Research and reply",
          "sub": "within 24 hours"
        },
        {
          "id": "a3",
          "label": "Hand over to the team",
          "tone": "accent"
        }
      ],
      "edges": [
        {
          "from": "start",
          "to": "q1"
        },
        {
          "from": "q1",
          "to": "a1",
          "label": "Yes"
        },
        {
          "from": "q1",
          "to": "q2",
          "label": "No"
        },
        {
          "from": "q2",
          "to": "a2",
          "label": "Yes"
        },
        {
          "from": "q2",
          "to": "a3",
          "label": "No"
        }
      ]
    }
  ],
  "lang": "en"
}


Steps

A procedure with no dates, as numbered boxes joined by arrows from left to right. Arrows back show rework.

Example of a steps
Example prompt

Using svg-diagram, draw the steps to issue an invoice as numbered steps. If the review finds a problem, it goes back to drafting.

JSON (the figure as the tool receives it)
{
  "version": 1,
  "title": "Issuing an invoice",
  "parts": [
    {
      "type": "steps",
      "numbered": true,
      "items": [
        {
          "title": "Confirm the order",
          "body": "Contract and amount"
        },
        {
          "title": "Draft the invoice",
          "body": "In the accounting app"
        },
        {
          "title": "Manager reviews",
          "body": "Amount and address"
        },
        {
          "title": "Send",
          "body": "PDF by email"
        }
      ],
      "loopBack": [
        {
          "from": 3,
          "to": 2,
          "label": "Send back"
        }
      ]
    }
  ],
  "lang": "en"
}
Process steps (chevron)

Steps with no branches, or the phases of a project, as arrow shapes from left to right. The current step can stand out.

Example of a process steps (chevron)
Example prompt

Using svg-diagram, draw the five phases of launching a new service as chevrons, from research to operation. We are in the design phase.

JSON (the figure as the tool receives it)
{
  "version": 1,
  "title": "Launching a new service",
  "parts": [
    {
      "type": "chevron",
      "current": 2,
      "steps": [
        {
          "label": "Research",
          "sub": "market and users"
        },
        {
          "label": "Design",
          "sub": "requirements"
        },
        {
          "label": "Build",
          "sub": "small slices"
        },
        {
          "label": "Pilot",
          "sub": "trial run"
        },
        {
          "label": "Operate",
          "sub": "keep improving"
        }
      ]
    }
  ],
  "lang": "en"
}
Cycle (PDCA)

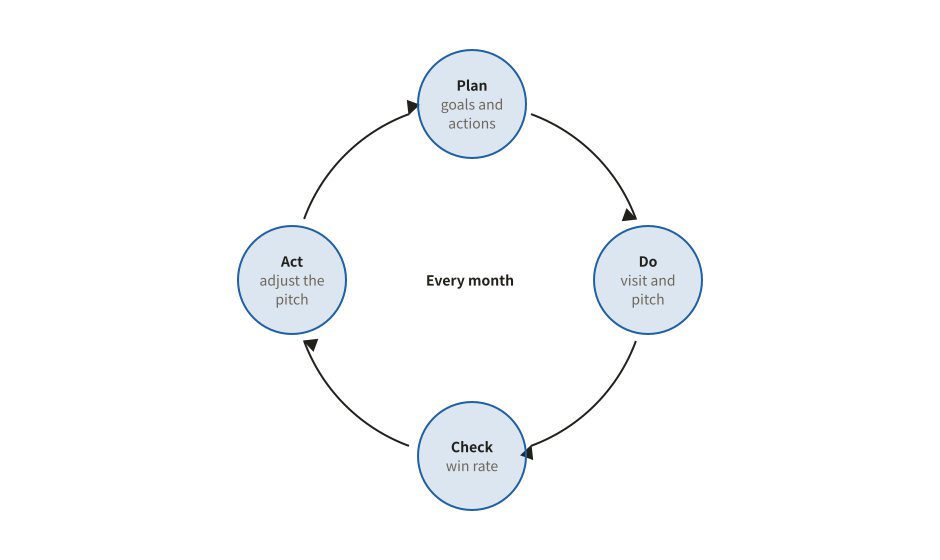
Steps that repeat, drawn on a circle: the last step leads back to the first.

Example of a cycle (pdca)
Example prompt

Using svg-diagram, draw a PDCA cycle for improving our sales activities, with what we do at each step.

JSON (the figure as the tool receives it)
{
  "version": 1,
  "title": "Sales PDCA",
  "parts": [
    {
      "type": "cycle",
      "centre": "Every month",
      "steps": [
        {
          "label": "Plan",
          "sub": "goals and actions"
        },
        {
          "label": "Do",
          "sub": "visit and pitch"
        },
        {
          "label": "Check",
          "sub": "win rate"
        },
        {
          "label": "Act",
          "sub": "adjust the pitch"
        }
      ]
    }
  ],
  "lang": "en"
}
Across people and systems

Swimlane (process flow)

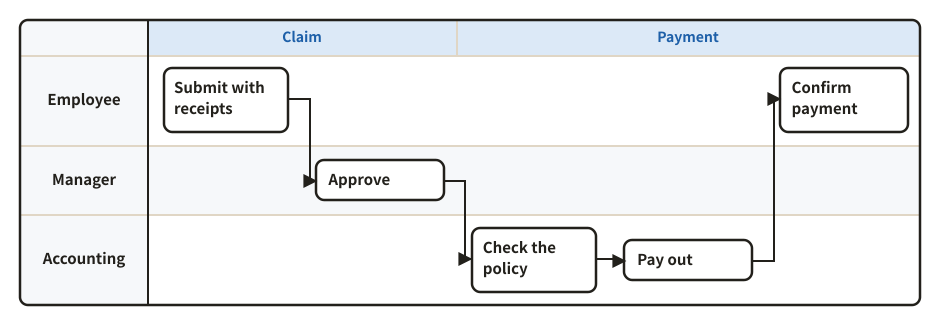
Who does what over time: one lane per role, columns for time. The hand-offs between roles are easy to see.

Example of a swimlane (process flow)
Example prompt

Using svg-diagram, draw the expense claim process as a swimlane with three lanes: employee, manager and accounting.

JSON (the figure as the tool receives it)
{
  "version": 1,
  "title": "Expense claims",
  "parts": [
    {
      "type": "swimlane",
      "lanes": [
        {
          "id": "app",
          "label": "Employee"
        },
        {
          "id": "mgr",
          "label": "Manager"
        },
        {
          "id": "acc",
          "label": "Accounting"
        }
      ],
      "steps": [
        {
          "id": "s1",
          "lane": "app",
          "title": "Submit with receipts",
          "col": 1
        },
        {
          "id": "s2",
          "lane": "mgr",
          "title": "Approve",
          "col": 2
        },
        {
          "id": "s3",
          "lane": "acc",
          "title": "Check the policy",
          "col": 3
        },
        {
          "id": "s4",
          "lane": "acc",
          "title": "Pay out",
          "col": 4
        },
        {
          "id": "s5",
          "lane": "app",
          "title": "Confirm payment",
          "col": 5
        }
      ],
      "flows": [
        {
          "from": "s1",
          "to": "s2"
        },
        {
          "from": "s2",
          "to": "s3"
        },
        {
          "from": "s3",
          "to": "s4"
        },
        {
          "from": "s4",
          "to": "s5"
        }
      ],
      "phases": [
        {
          "label": "Claim",
          "from": 1,
          "to": 2
        },
        {
          "label": "Payment",
          "from": 3,
          "to": 5
        }
      ]
    }
  ],
  "lang": "en"
}
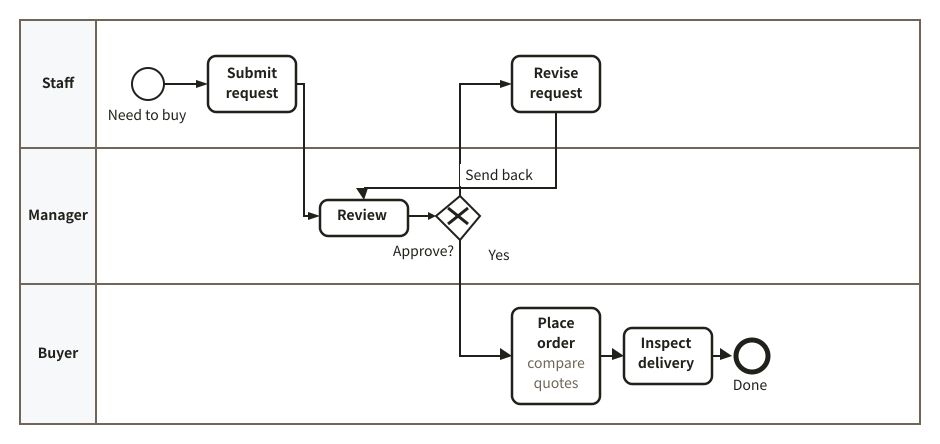
BPMN process diagram

Tasks, start and end events and gateways placed in lanes by who does them, to show a business process in BPMN notation.

Example of a bpmn process diagram
Example prompt

Using svg-diagram, draw the approval process for a purchase request in BPMN, with lanes for the staff member, the manager and the buyer, including sending it back.

JSON (the figure as the tool receives it)
{
  "version": 1,
  "title": "Purchase request approval",
  "parts": [
    {
      "type": "bpmn",
      "lanes": [
        {
          "id": "req",
          "label": "Staff"
        },
        {
          "id": "mgr",
          "label": "Manager"
        },
        {
          "id": "buy",
          "label": "Buyer"
        }
      ],
      "nodes": [
        {
          "id": "st",
          "lane": "req",
          "kind": "start",
          "label": "Need to buy"
        },
        {
          "id": "apply",
          "lane": "req",
          "label": "Submit request"
        },
        {
          "id": "review",
          "lane": "mgr",
          "label": "Review"
        },
        {
          "id": "ok",
          "lane": "mgr",
          "kind": "xor",
          "label": "Approve?"
        },
        {
          "id": "fix",
          "lane": "req",
          "label": "Revise request"
        },
        {
          "id": "order",
          "lane": "buy",
          "label": "Place order",
          "sub": "compare quotes"
        },
        {
          "id": "check",
          "lane": "buy",
          "label": "Inspect delivery"
        },
        {
          "id": "end",
          "lane": "buy",
          "kind": "end",
          "label": "Done"
        }
      ],
      "flows": [
        {
          "from": "st",
          "to": "apply"
        },
        {
          "from": "apply",
          "to": "review"
        },
        {
          "from": "review",
          "to": "ok"
        },
        {
          "from": "ok",
          "to": "order",
          "label": "Yes"
        },
        {
          "from": "ok",
          "to": "fix",
          "label": "Send back"
        },
        {
          "from": "fix",
          "to": "review"
        },
        {
          "from": "order",
          "to": "check"
        },
        {
          "from": "check",
          "to": "end"
        }
      ]
    }
  ],
  "lang": "en"
}
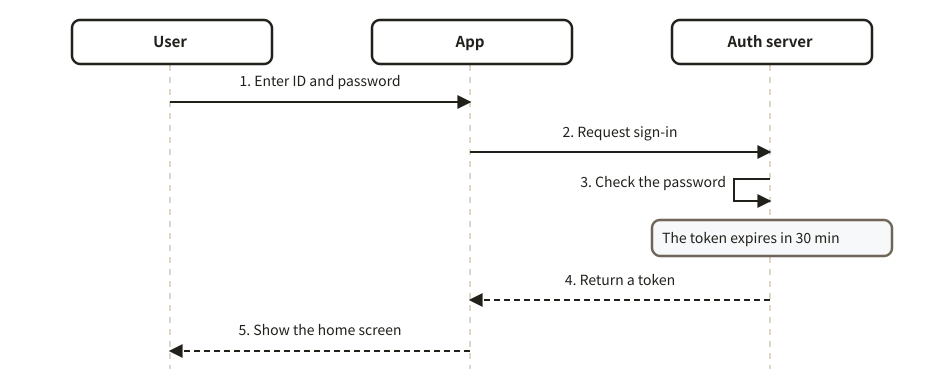
Sequence diagram

Messages between people or systems, in time order from the top, with numbered messages, notes and dividers.

Example of a sequence diagram
Example prompt

Using svg-diagram, draw a sequence diagram of signing in, between the user, the app and the auth server.

JSON (the figure as the tool receives it)
{
  "version": 1,
  "title": "Signing in",
  "parts": [
    {
      "type": "sequence",
      "actors": [
        {
          "id": "u",
          "label": "User"
        },
        {
          "id": "app",
          "label": "App"
        },
        {
          "id": "auth",
          "label": "Auth server"
        }
      ],
      "steps": [
        {
          "from": "u",
          "to": "app",
          "label": "Enter ID and password"
        },
        {
          "from": "app",
          "to": "auth",
          "label": "Request sign-in"
        },
        {
          "self": "auth",
          "label": "Check the password"
        },
        {
          "note": "The token expires in 30 min",
          "over": [
            "auth"
          ]
        },
        {
          "from": "auth",
          "to": "app",
          "label": "Return a token",
          "line": "dashed"
        },
        {
          "from": "app",
          "to": "u",
          "label": "Show the home screen",
          "line": "dashed"
        }
      ]
    }
  ],
  "lang": "en"
}
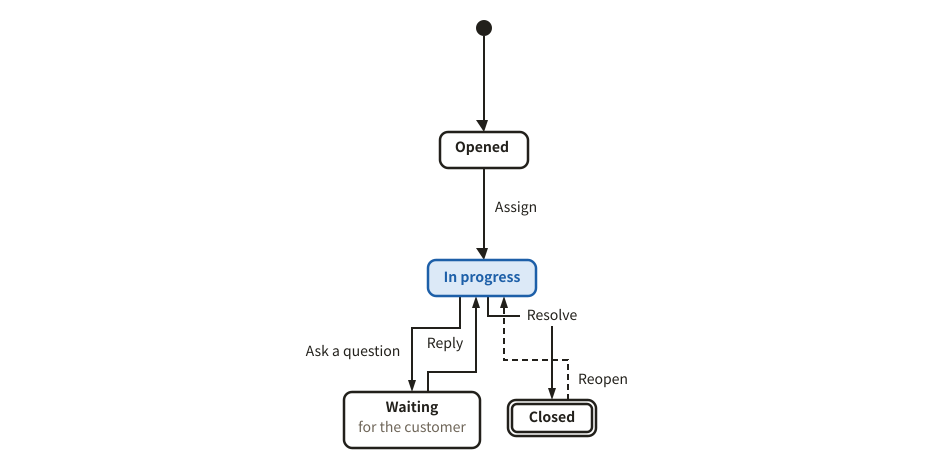
State diagram

The states something goes through, such as an order or a ticket, and the events that move it. A dot marks the start, a double frame the end.

Example of a state diagram
Example prompt

Using svg-diagram, draw a state diagram of a support ticket, from opened to closed, including reopening.

JSON (the figure as the tool receives it)
{
  "version": 1,
  "title": "Support ticket states",
  "parts": [
    {
      "type": "stateDiagram",
      "dir": "down",
      "initial": "new",
      "states": [
        {
          "id": "new",
          "label": "Opened"
        },
        {
          "id": "doing",
          "label": "In progress",
          "tone": "accent"
        },
        {
          "id": "wait",
          "label": "Waiting",
          "sub": "for the customer"
        },
        {
          "id": "done",
          "label": "Closed",
          "final": true
        }
      ],
      "transitions": [
        {
          "from": "new",
          "to": "doing",
          "label": "Assign"
        },
        {
          "from": "doing",
          "to": "wait",
          "label": "Ask a question"
        },
        {
          "from": "wait",
          "to": "doing",
          "label": "Reply"
        },
        {
          "from": "doing",
          "to": "done",
          "label": "Resolve"
        },
        {
          "from": "done",
          "to": "doing",
          "label": "Reopen",
          "line": "dashed"
        }
      ]
    }
  ],
  "lang": "en"
}
System structure

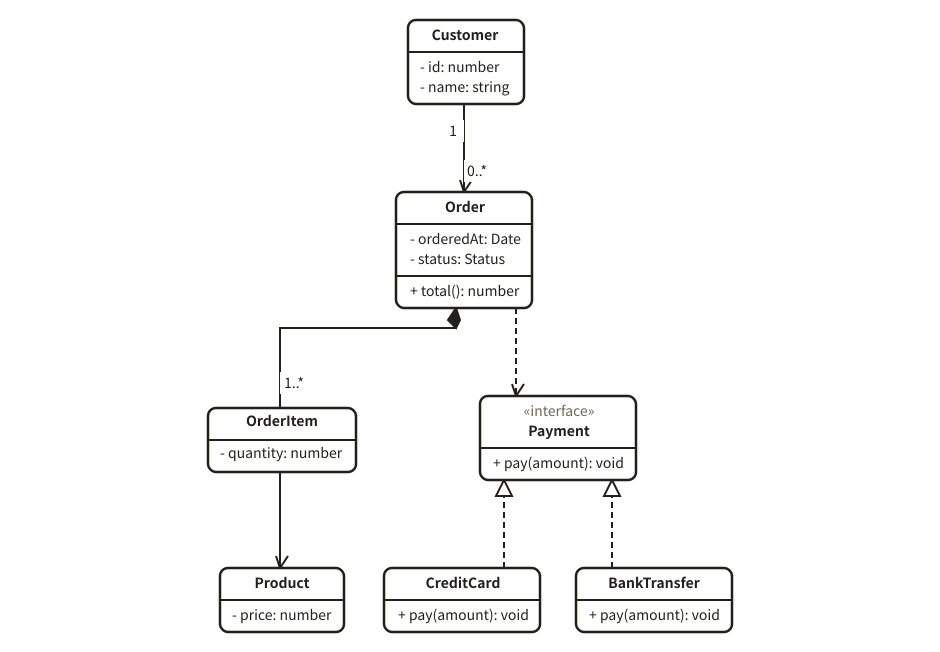
Class diagram

Classes with their attributes and operations, and how they relate (inheritance, implementation, aggregation, composition) in UML notation. Parents are placed above.

Example of a class diagram
Example prompt

Using svg-diagram, draw a class diagram of the order model of an online shop: customer, order, order line, product, and a payment method interface.

JSON (the figure as the tool receives it)
{
  "version": 1,
  "title": "Online shop order model",
  "parts": [
    {
      "type": "classDiagram",
      "classes": [
        {
          "id": "Customer",
          "attrs": [
            "- id: number",
            "- name: string"
          ]
        },
        {
          "id": "Order",
          "attrs": [
            "- orderedAt: Date",
            "- status: Status"
          ],
          "methods": [
            "+ total(): number"
          ]
        },
        {
          "id": "OrderItem",
          "attrs": [
            "- quantity: number"
          ]
        },
        {
          "id": "Product",
          "attrs": [
            "- price: number"
          ]
        },
        {
          "id": "Payment",
          "stereotype": "interface",
          "methods": [
            "+ pay(amount): void"
          ]
        },
        {
          "id": "Card",
          "name": "CreditCard",
          "methods": [
            "+ pay(amount): void"
          ]
        },
        {
          "id": "Bank",
          "name": "BankTransfer",
          "methods": [
            "+ pay(amount): void"
          ]
        }
      ],
      "relations": [
        {
          "from": "Customer",
          "to": "Order",
          "kind": "arrow",
          "fromMult": "1",
          "toMult": "0..*"
        },
        {
          "from": "Order",
          "to": "OrderItem",
          "kind": "compose",
          "toMult": "1..*"
        },
        {
          "from": "OrderItem",
          "to": "Product",
          "kind": "arrow"
        },
        {
          "from": "Order",
          "to": "Payment",
          "kind": "depend"
        },
        {
          "from": "Card",
          "to": "Payment",
          "kind": "implement"
        },
        {
          "from": "Bank",
          "to": "Payment",
          "kind": "implement"
        }
      ]
    }
  ],
  "lang": "en"
}
Dependency network

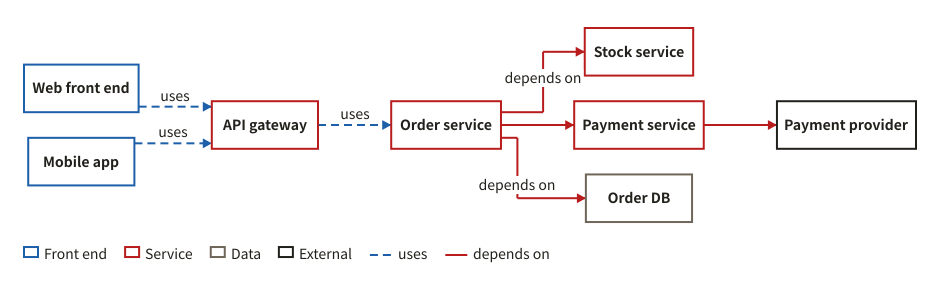
How services or modules depend on each other, with a different line for each kind of link ("uses", "depends on" ...). The kinds are named in the legend.

Example of a dependency network
Example prompt

Using svg-diagram, draw the dependencies between the microservices of an online shop: the front ends, the API gateway, the order, stock and payment services, the database and the external payment provider.

JSON (the figure as the tool receives it)
{
  "version": 1,
  "title": "Online shop service dependencies",
  "parts": [
    {
      "type": "dependencyNetwork",
      "nodes": [
        {
          "id": "web",
          "label": "Web front end",
          "kind": "Front end"
        },
        {
          "id": "app",
          "label": "Mobile app",
          "kind": "Front end"
        },
        {
          "id": "gw",
          "label": "API gateway",
          "kind": "Service"
        },
        {
          "id": "order",
          "label": "Order service",
          "kind": "Service"
        },
        {
          "id": "stock",
          "label": "Stock service",
          "kind": "Service"
        },
        {
          "id": "pay",
          "label": "Payment service",
          "kind": "Service"
        },
        {
          "id": "db",
          "label": "Order DB",
          "kind": "Data"
        },
        {
          "id": "psp",
          "label": "Payment provider",
          "kind": "External"
        }
      ],
      "edges": [
        {
          "from": "web",
          "to": "gw",
          "type": "uses"
        },
        {
          "from": "app",
          "to": "gw",
          "type": "uses"
        },
        {
          "from": "gw",
          "to": "order",
          "type": "uses"
        },
        {
          "from": "order",
          "to": "stock",
          "type": "depends"
        },
        {
          "from": "order",
          "to": "pay",
          "type": "depends"
        },
        {
          "from": "order",
          "to": "db",
          "type": "depends"
        },
        {
          "from": "pay",
          "to": "psp",
          "type": "depends"
        }
      ]
    }
  ],
  "lang": "en"
}
Plans and progress

Who does what and when, and how far it has got.

Schedules

Gantt chart

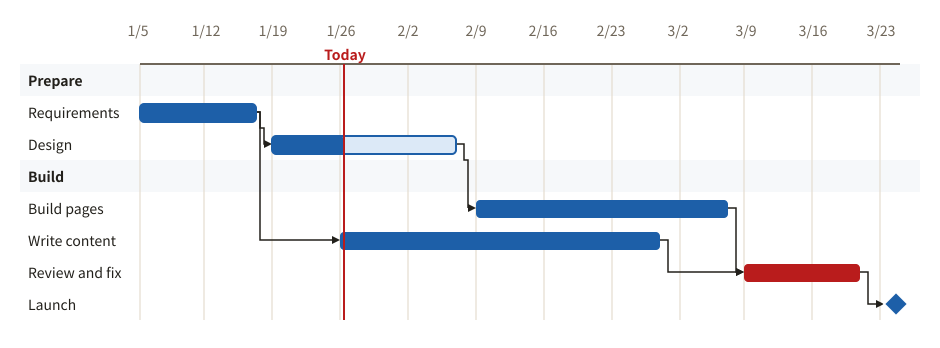
Tasks on a calendar, with sections, milestones, progress and the tasks each one waits for. A line can mark today.

Example of a gantt chart
Example prompt

Using svg-diagram, make a Gantt chart for a website redesign from January to March 2026, with task dependencies and a launch milestone.

JSON (the figure as the tool receives it)
{
  "version": 1,
  "title": "Website redesign",
  "parts": [
    {
      "type": "gantt",
      "today": "2026-01-26",
      "todayLabel": "Today",
      "rows": [
        {
          "section": "Prepare"
        },
        {
          "id": "req",
          "label": "Requirements",
          "start": "2026-01-05",
          "end": "2026-01-16",
          "progress": 1
        },
        {
          "id": "design",
          "label": "Design",
          "start": "2026-01-19",
          "end": "2026-02-06",
          "progress": 0.4,
          "after": "req"
        },
        {
          "section": "Build"
        },
        {
          "id": "build",
          "label": "Build pages",
          "start": "2026-02-09",
          "end": "2026-03-06",
          "after": "design"
        },
        {
          "id": "content",
          "label": "Write content",
          "start": "2026-01-26",
          "end": "2026-02-27",
          "after": "req"
        },
        {
          "id": "test",
          "label": "Review and fix",
          "start": "2026-03-09",
          "end": "2026-03-20",
          "after": [
            "build",
            "content"
          ],
          "tone": "danger"
        },
        {
          "label": "Launch",
          "start": "2026-03-24",
          "milestone": true,
          "after": "test"
        }
      ]
    }
  ],
  "lang": "en"
}
PERT chart (critical path)

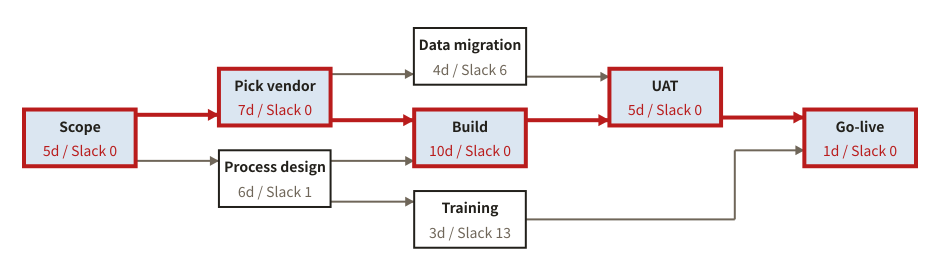
From how long each task takes and what must finish first, the earliest and latest start and finish and the slack are worked out, and the critical path, where any delay delays the whole, is drawn in red.

Example of a pert chart (critical path)
Example prompt

Using svg-diagram, make a PERT chart of rolling out a new internal system and show the critical path: requirements, vendor selection, process design, build, data migration, training, acceptance testing, go-live.

JSON (the figure as the tool receives it)
{
  "version": 1,
  "title": "Rolling out an internal system",
  "parts": [
    {
      "type": "pert",
      "unit": "d",
      "compact": true,
      "tasks": [
        {
          "id": "req",
          "label": "Scope",
          "duration": 5
        },
        {
          "id": "vendor",
          "label": "Pick vendor",
          "duration": 7,
          "predecessors": [
            "req"
          ]
        },
        {
          "id": "flow",
          "label": "Process design",
          "duration": 6,
          "predecessors": [
            "req"
          ]
        },
        {
          "id": "dev",
          "label": "Build",
          "duration": 10,
          "predecessors": [
            "vendor",
            "flow"
          ]
        },
        {
          "id": "data",
          "label": "Data migration",
          "duration": 4,
          "predecessors": [
            "vendor"
          ]
        },
        {
          "id": "train",
          "label": "Training",
          "duration": 3,
          "predecessors": [
            "flow"
          ]
        },
        {
          "id": "uat",
          "label": "UAT",
          "duration": 5,
          "predecessors": [
            "dev",
            "data"
          ]
        },
        {
          "id": "go",
          "label": "Go-live",
          "duration": 1,
          "predecessors": [
            "uat",
            "train"
          ]
        }
      ]
    }
  ],
  "lang": "en"
}
Roadmap

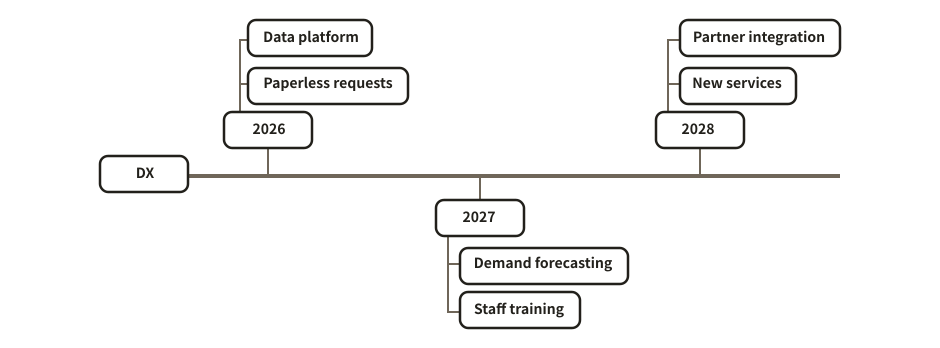
The timeline layout of a mind map: what to do in each period.

Example of a roadmap
Example prompt

Using svg-diagram, draw a three-year roadmap for our digital transformation, with two or three initiatives a year.

JSON (the figure as the tool receives it)
{
  "version": 1,
  "title": "Digital transformation roadmap",
  "parts": [
    {
      "type": "mindmap",
      "layout": "timeline",
      "root": {
        "label": "DX",
        "children": [
          {
            "label": "2026",
            "children": [
              {
                "label": "Paperless requests"
              },
              {
                "label": "Data platform"
              }
            ]
          },
          {
            "label": "2027",
            "children": [
              {
                "label": "Demand forecasting"
              },
              {
                "label": "Staff training"
              }
            ]
          },
          {
            "label": "2028",
            "children": [
              {
                "label": "New services"
              },
              {
                "label": "Partner integration"
              }
            ]
          }
        ]
      }
    }
  ],
  "lang": "en"
}
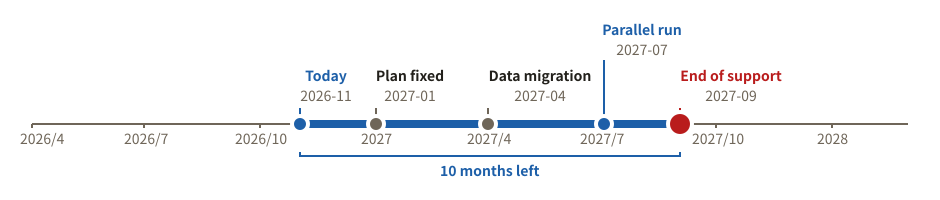
Timeline to a deadline

Today and the deadline on a time axis, with the time left between them and the milestones on the way. The dates are always written out, so the figure never changes by itself.

Example of a timeline to a deadline
Example prompt

Using svg-diagram, support for our current system ends in September 2027. Draw a timeline of the time left from today (November 2026) and the migration milestones.

JSON (the figure as the tool receives it)
{
  "version": 1,
  "title": "Time left until support ends",
  "parts": [
    {
      "type": "timeline",
      "from": "2026-04",
      "to": "2028-03",
      "now": {
        "at": "2026-11",
        "label": "Today"
      },
      "deadline": {
        "at": "2027-09",
        "label": "End of support"
      },
      "marks": [
        {
          "at": "2027-01",
          "label": "Plan fixed"
        },
        {
          "at": "2027-04",
          "label": "Data migration"
        },
        {
          "at": "2027-07",
          "label": "Parallel run",
          "tone": "accent"
        }
      ]
    }
  ],
  "lang": "en"
}
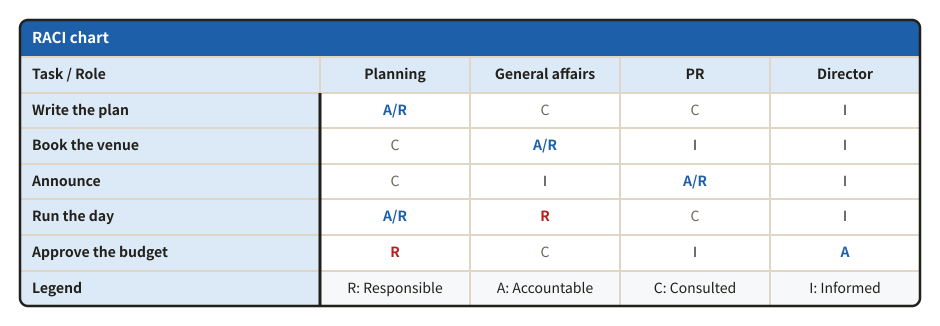
Who does what

RACI chart

For each task, who is Responsible, Accountable, Consulted and Informed. It checks that each task has one A and at least one R.

Example of a raci chart
Example prompt

Using svg-diagram, make a RACI chart for organizing a company event. Roles: planning, general affairs, PR and the director.

JSON (the figure as the tool receives it)
{
  "version": 1,
  "title": "Company event roles",
  "parts": [
    {
      "type": "raci",
      "title": "RACI chart",
      "corner": "Task / Role",
      "legend": true,
      "tasks": [
        "Write the plan",
        "Book the venue",
        "Announce",
        "Run the day",
        "Approve the budget"
      ],
      "roles": [
        "Planning",
        "General affairs",
        "PR",
        "Director"
      ],
      "assignments": [
        [
          "A/R",
          "C",
          "C",
          "I"
        ],
        [
          "C",
          "A/R",
          "I",
          "I"
        ],
        [
          "C",
          "I",
          "A/R",
          "I"
        ],
        [
          "A/R",
          "R",
          "C",
          "I"
        ],
        [
          "R",
          "C",
          "I",
          "A"
        ]
      ]
    }
  ],
  "lang": "en"
}
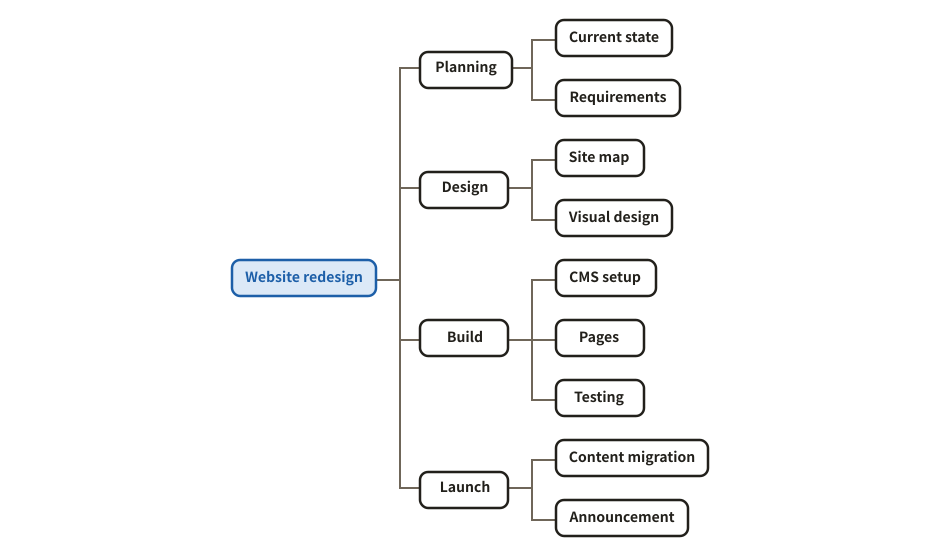
Tree diagram (WBS)

The whole at the top and what it breaks down into below. Use it for a work breakdown structure (WBS), an organization or a hierarchy of categories.

Example of a tree diagram (wbs)
Example prompt

Using svg-diagram, break down the work of a website redesign into a WBS tree, in four parts: planning, design, build and launch.

JSON (the figure as the tool receives it)
{
  "version": 1,
  "title": "Website redesign WBS",
  "parts": [
    {
      "type": "tree",
      "dir": "right",
      "root": {
        "label": "Website redesign",
        "tone": "accent",
        "children": [
          {
            "label": "Planning",
            "children": [
              {
                "label": "Current state"
              },
              {
                "label": "Requirements"
              }
            ]
          },
          {
            "label": "Design",
            "children": [
              {
                "label": "Site map"
              },
              {
                "label": "Visual design"
              }
            ]
          },
          {
            "label": "Build",
            "children": [
              {
                "label": "CMS setup"
              },
              {
                "label": "Pages"
              },
              {
                "label": "Testing"
              }
            ]
          },
          {
            "label": "Launch",
            "children": [
              {
                "label": "Content migration"
              },
              {
                "label": "Announcement"
              }
            ]
          }
        ]
      }
    }
  ],
  "lang": "en"
}
Progress

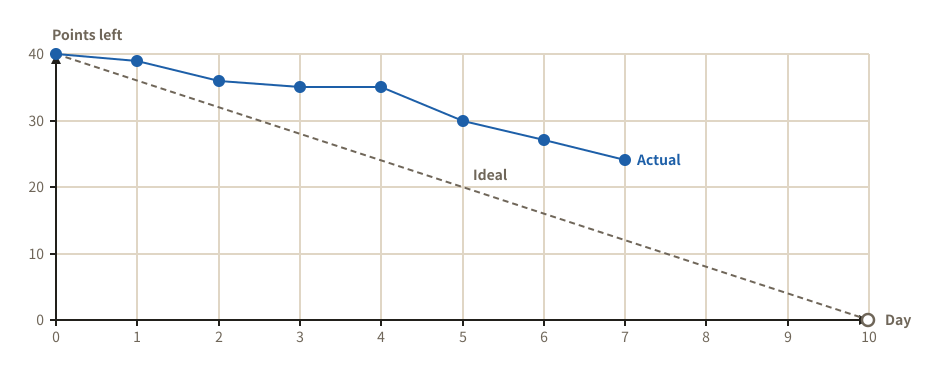
Burndown chart

The work left in a sprint, day by day, against the ideal line, so a delay shows at once.

Example of a burndown chart
Example prompt

Using svg-diagram, draw a burndown chart of a 10-day sprint of 40 points. Today is day 7.

JSON (the figure as the tool receives it)
{
  "version": 1,
  "title": "Sprint 12 burndown",
  "parts": [
    {
      "type": "burndown",
      "total": 40,
      "days": 10,
      "actual": [
        40,
        39,
        36,
        35,
        35,
        30,
        27,
        24
      ],
      "yLabel": "Points left"
    }
  ],
  "lang": "en"
}
Burnup chart

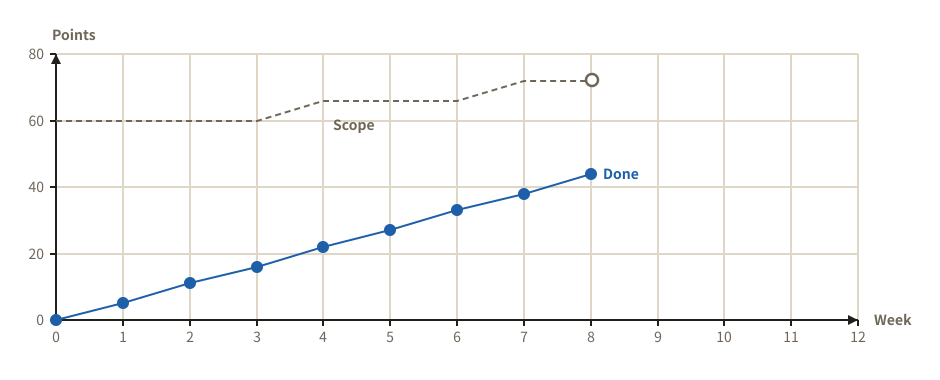
The work done climbing towards a scope that grows, so added requests show too.

Example of a burnup chart
Example prompt

Using svg-diagram, draw a burnup chart for the 12 weeks to release. Requests grew the scope from 60 to 72 on the way.

JSON (the figure as the tool receives it)
{
  "version": 1,
  "title": "Release 2.0 burnup",
  "parts": [
    {
      "type": "burnup",
      "days": 12,
      "scope": [
        60,
        60,
        60,
        60,
        66,
        66,
        66,
        72,
        72
      ],
      "done": [
        0,
        5,
        11,
        16,
        22,
        27,
        33,
        38,
        44
      ],
      "xLabel": "Week",
      "yLabel": "Points"
    }
  ],
  "lang": "en"
}
Problem solving

Dig for causes, resolve conflicts, choose what to do.

Theory of Constraints

Current Reality Tree (CRT)

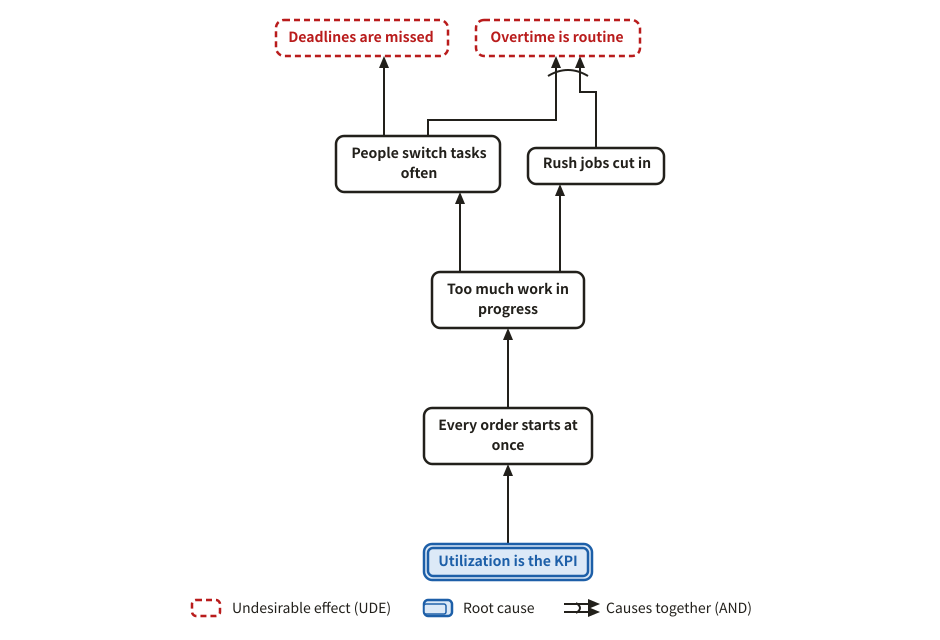
The Theory of Constraints CRT: from undesirable effects (UDEs) down to the root cause, cause below effect. An AND (causes that act only together) can be drawn too.

Example of a current reality tree (crt)
Example prompt

Using svg-diagram, we keep missing deadlines. Draw a Current Reality Tree (TOC) of the situation, telling the UDEs apart from the root cause.

JSON (the figure as the tool receives it)
{
  "version": 1,
  "title": "Why deadlines slip",
  "legend": "auto",
  "parts": [
    {
      "type": "causeTree",
      "tree": "crt",
      "nodes": [
        {
          "id": "u1",
          "label": "Deadlines are missed",
          "role": "ude"
        },
        {
          "id": "u2",
          "label": "Overtime is routine",
          "role": "ude"
        },
        {
          "id": "e1",
          "label": "People switch tasks often"
        },
        {
          "id": "e2",
          "label": "Rush jobs cut in"
        },
        {
          "id": "e3",
          "label": "Too much work in progress"
        },
        {
          "id": "e4",
          "label": "Every order starts at once"
        },
        {
          "id": "r1",
          "label": "Utilization is the KPI",
          "role": "root"
        }
      ],
      "links": [
        {
          "from": "r1",
          "to": "e4"
        },
        {
          "from": "e4",
          "to": "e3"
        },
        {
          "from": "e3",
          "to": "e1"
        },
        {
          "from": "e3",
          "to": "e2"
        },
        {
          "from": "e1",
          "to": "u1"
        },
        {
          "from": [
            "e1",
            "e2"
          ],
          "to": "u2"
        }
      ]
    }
  ],
  "lang": "en"
}
Future Reality Tree (FRT)

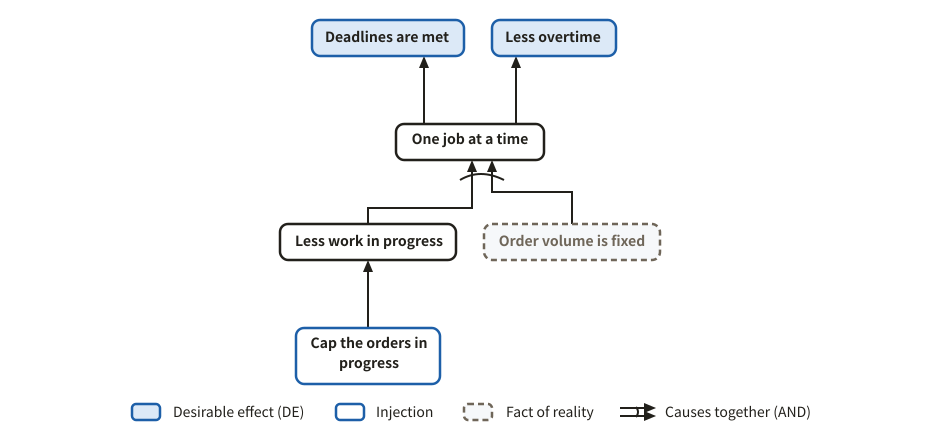
What happens once a change (an injection) is made, all the way to the desired effects. Facts nobody controls can be drawn in.

Example of a future reality tree (frt)
Example prompt

Using svg-diagram, draw a Future Reality Tree of how capping the number of orders in progress would fix missed deadlines.

JSON (the figure as the tool receives it)
{
  "version": 1,
  "title": "Capping work in progress",
  "legend": "auto",
  "parts": [
    {
      "type": "causeTree",
      "tree": "frt",
      "nodes": [
        {
          "id": "d1",
          "label": "Deadlines are met",
          "role": "de"
        },
        {
          "id": "d2",
          "label": "Less overtime",
          "role": "de"
        },
        {
          "id": "e1",
          "label": "Less work in progress"
        },
        {
          "id": "e2",
          "label": "One job at a time"
        },
        {
          "id": "i1",
          "label": "Cap the orders in progress",
          "role": "injection"
        },
        {
          "id": "p1",
          "label": "Order volume is fixed",
          "role": "precondition"
        }
      ],
      "links": [
        {
          "from": "i1",
          "to": "e1"
        },
        {
          "from": [
            "e1",
            "p1"
          ],
          "to": "e2"
        },
        {
          "from": "e2",
          "to": "d1"
        },
        {
          "from": "e2",
          "to": "d2"
        }
      ]
    }
  ],
  "lang": "en"
}

Conflict cloud (evaporating cloud)

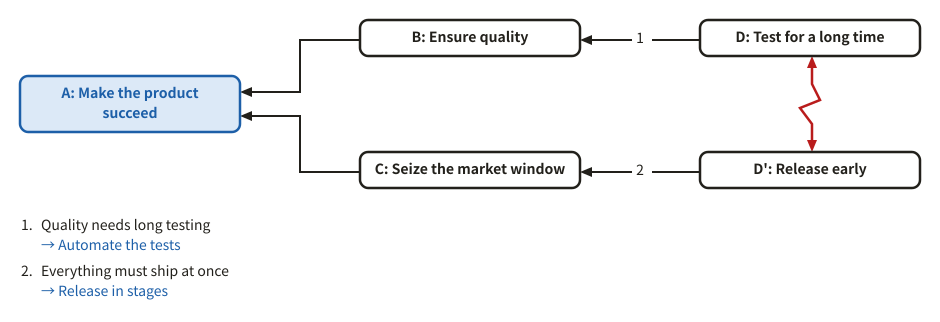
The common objective A, the needs B and C, and the conflicting wants D and D'. The assumptions behind an arrow, and the injection that breaks one.

Example of a conflict cloud (evaporating cloud)
Example prompt

Using svg-diagram, we want quality but also a fast release. Draw this dilemma as a conflict cloud, with assumptions and injections.

JSON (the figure as the tool receives it)
{
  "version": 1,
  "title": "Quality versus speed",
  "parts": [
    {
      "type": "cloud",
      "a": "Make the product succeed",
      "b": "Ensure quality",
      "c": "Seize the market window",
      "d": "Test for a long time",
      "d2": "Release early",
      "assumptions": [
        {
          "on": "bd",
          "text": "Quality needs long testing",
          "injection": "Automate the tests"
        },
        {
          "on": "cd",
          "text": "Everything must ship at once",
          "injection": "Release in stages"
        }
      ]
    }
  ],
  "lang": "en"
}
Finding causes

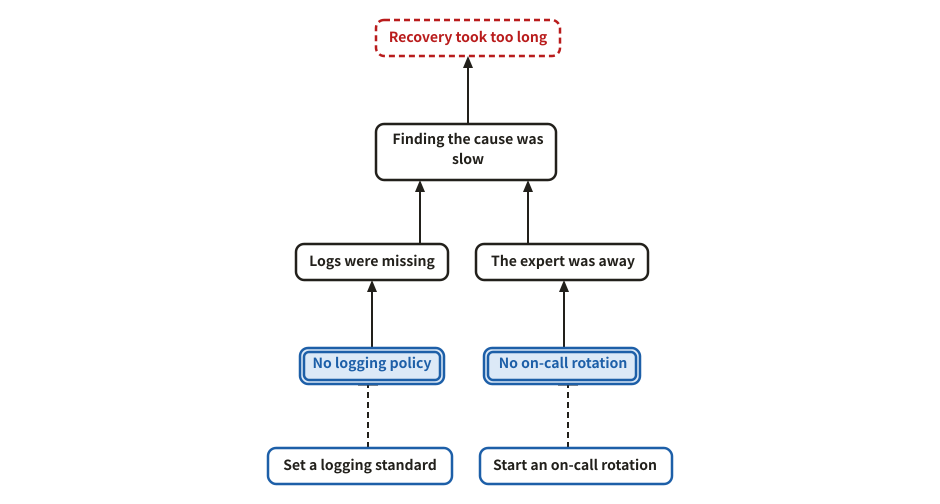
5 whys

From the problem, ask "why?" again and again down to the root causes and what to do about them. Root causes have a double frame, measures a dashed one.

Example of a 5 whys
Example prompt

Using svg-diagram, run a 5-whys analysis of why recovering from a production outage took so long, with root causes and measures.

JSON (the figure as the tool receives it)
{
  "version": 1,
  "title": "Why recovery was slow",
  "parts": [
    {
      "type": "whyWhyTree",
      "readingNote": false,
      "problem": "Recovery took too long",
      "whys": [
        {
          "why": "Finding the cause was slow",
          "because": [
            {
              "why": "Logs were missing",
              "because": [
                {
                  "why": "No logging policy",
                  "trueCause": true,
                  "measure": "Set a logging standard"
                }
              ]
            },
            {
              "why": "The expert was away",
              "because": [
                {
                  "why": "No on-call rotation",
                  "trueCause": true,
                  "measure": "Start an on-call rotation"
                }
              ]
            }
          ]
        }
      ]
    }
  ],
  "lang": "en"
}
Why-why analysis (table)

Each row asks "why?" from the problem down to a root cause and what is done about it, so a chain reads in one line. With few branches, a table reads more easily than a tree.

Example of a why-why analysis (table)
Example prompt

Using svg-diagram, make a why-why analysis table of why our replies to inquiries are late. Two chains, each down to a root cause and a measure.

JSON (the figure as the tool receives it)
{
  "version": 1,
  "title": "Late replies to inquiries",
  "parts": [
    {
      "type": "whyWhyTable",
      "problem": "Replies are late",
      "chains": [
        {
          "whys": [
            "Assigning an owner takes time",
            "Inquiries are sorted by hand",
            "The type of inquiry is unknown"
          ],
          "trueCause": "The form has no field for the type",
          "measure": "Add a type choice to the form"
        },
        {
          "whys": [
            "Waiting long for review",
            "Only one reviewer"
          ],
          "trueCause": "Review rights sit with one person",
          "measure": "Skip review for standard replies"
        }
      ]
    }
  ],
  "lang": "en"
}
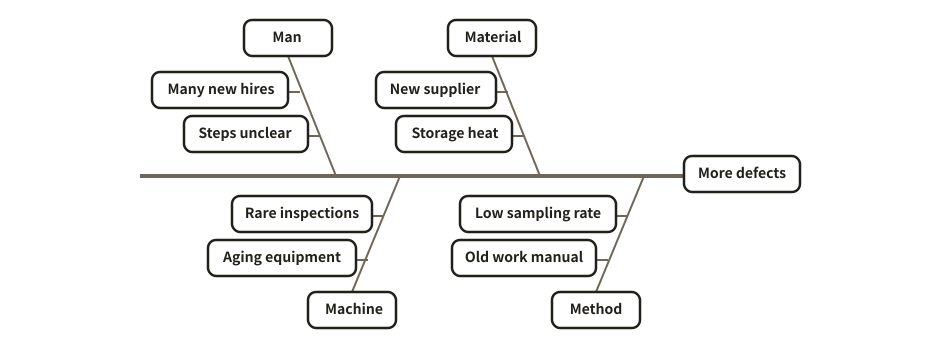
Fishbone (cause and effect)

The fishbone layout of a mind map: the causes of an effect, sorted into main and sub bones.

Example of a fishbone (cause and effect)
Example prompt

Using svg-diagram, organize why defects are increasing as a fishbone diagram, using the 4Ms: man, machine, material, method.

JSON (the figure as the tool receives it)
{
  "version": 1,
  "title": "Why defects increase",
  "parts": [
    {
      "type": "mindmap",
      "layout": "fishbone",
      "root": {
        "label": "More defects",
        "children": [
          {
            "label": "Man",
            "children": [
              {
                "label": "Many new hires"
              },
              {
                "label": "Steps unclear"
              }
            ]
          },
          {
            "label": "Machine",
            "children": [
              {
                "label": "Aging equipment"
              },
              {
                "label": "Rare inspections"
              }
            ]
          },
          {
            "label": "Material",
            "children": [
              {
                "label": "New supplier"
              },
              {
                "label": "Storage heat"
              }
            ]
          },
          {
            "label": "Method",
            "children": [
              {
                "label": "Old work manual"
              },
              {
                "label": "Low sampling rate"
              }
            ]
          }
        ]
      }
    }
  ],
  "lang": "en"
}
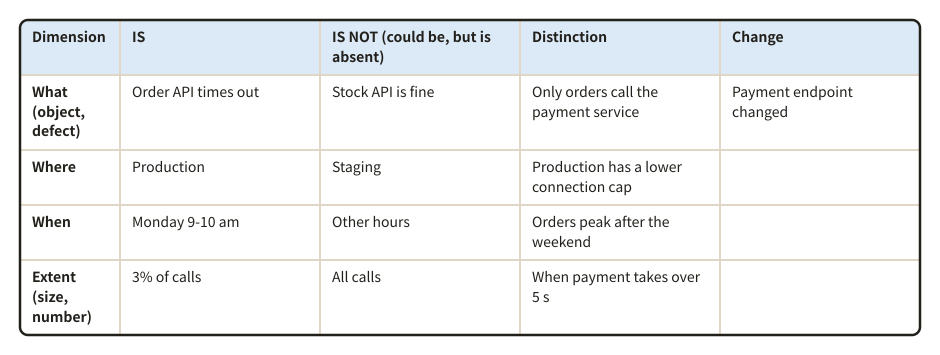
IS / IS NOT analysis

Where the problem happens set against where it could happen but does not; the distinctions and what changed point to the cause.

Example of a is / is not analysis
Example prompt

Using svg-diagram, put our API timeouts into an IS / IS NOT table: what, where, when and how much.

JSON (the figure as the tool receives it)
{
  "version": 1,
  "title": "IS / IS NOT of the API timeouts",
  "parts": [
    {
      "type": "isIsNot",
      "rows": [
        {
          "dim": "what",
          "is": "Order API times out",
          "isNot": "Stock API is fine",
          "distinct": "Only orders call the payment service",
          "change": "Payment endpoint changed"
        },
        {
          "dim": "where",
          "is": "Production",
          "isNot": "Staging",
          "distinct": "Production has a lower connection cap"
        },
        {
          "dim": "when",
          "is": "Monday 9-10 am",
          "isNot": "Other hours",
          "distinct": "Orders peak after the weekend"
        },
        {
          "dim": "extent",
          "is": "3% of calls",
          "isNot": "All calls",
          "distinct": "When payment takes over 5 s"
        }
      ]
    }
  ],
  "lang": "en"
}
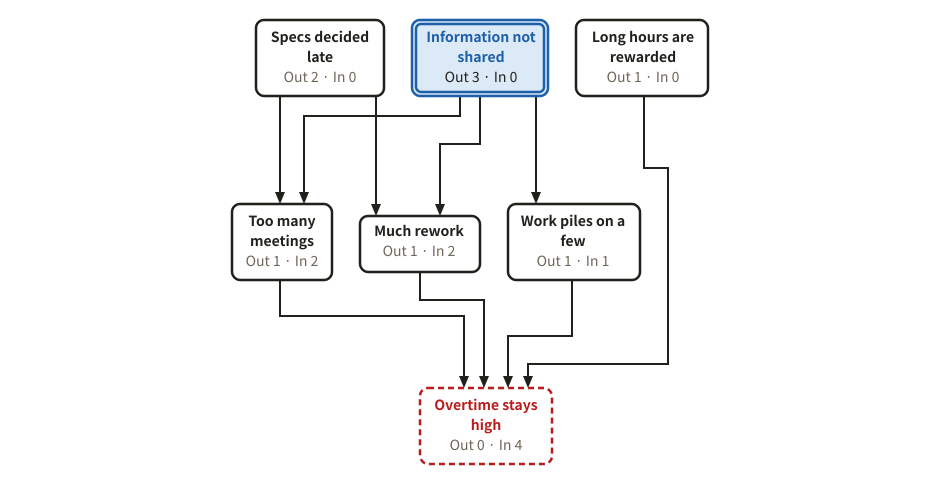
Relations diagram

Tangled factors joined by arrows from cause to effect. Each factor counts its arrows out and in; the one with the most arrows out is marked as the key cause.

Example of a relations diagram
Example prompt

Using svg-diagram, draw a relations diagram of why overtime does not go down, with arrows between the factors, so that the key cause stands out.

JSON (the figure as the tool receives it)
{
  "version": 1,
  "title": "Why overtime does not go down",
  "parts": [
    {
      "type": "relationDiagram",
      "problem": "over",
      "maxNodeW": 150,
      "nodes": [
        {
          "id": "over",
          "label": "Overtime stays high"
        },
        {
          "id": "meet",
          "label": "Too many meetings"
        },
        {
          "id": "late",
          "label": "Specs decided late"
        },
        {
          "id": "redo",
          "label": "Much rework"
        },
        {
          "id": "one",
          "label": "Work piles on a few"
        },
        {
          "id": "share",
          "label": "Information not shared"
        },
        {
          "id": "eval",
          "label": "Long hours are rewarded"
        }
      ],
      "links": [
        {
          "from": "late",
          "to": "redo"
        },
        {
          "from": "redo",
          "to": "over"
        },
        {
          "from": "meet",
          "to": "over"
        },
        {
          "from": "one",
          "to": "over"
        },
        {
          "from": "share",
          "to": "redo"
        },
        {
          "from": "share",
          "to": "one"
        },
        {
          "from": "share",
          "to": "meet"
        },
        {
          "from": "eval",
          "to": "over"
        },
        {
          "from": "late",
          "to": "meet"
        }
      ]
    }
  ],
  "lang": "en"
}
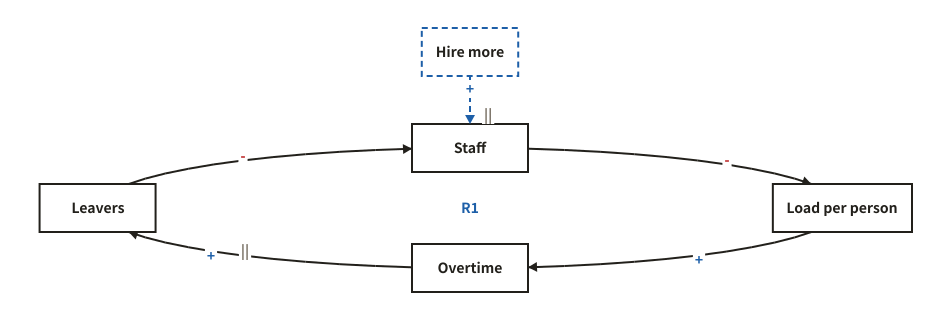
Causal loop diagram

Variables joined by + / - arrows, with reinforcing (R) and balancing (B) loops found and named. A delayed effect is marked ||.

Example of a causal loop diagram
Example prompt

Using svg-diagram, draw a causal loop diagram of the vicious circle where understaffing causes overtime and people leave, with hiring as a lever.

JSON (the figure as the tool receives it)
{
  "version": 1,
  "title": "The understaffing loop",
  "parts": [
    {
      "type": "causalLoop",
      "layout": "ring",
      "nodes": [
        {
          "id": "staff",
          "label": "Staff"
        },
        {
          "id": "load",
          "label": "Load per person"
        },
        {
          "id": "over",
          "label": "Overtime"
        },
        {
          "id": "quit",
          "label": "Leavers"
        }
      ],
      "links": [
        {
          "from": "staff",
          "to": "load",
          "polarity": "-"
        },
        {
          "from": "load",
          "to": "over",
          "polarity": "+"
        },
        {
          "from": "over",
          "to": "quit",
          "polarity": "+",
          "delay": true
        },
        {
          "from": "quit",
          "to": "staff",
          "polarity": "-"
        }
      ],
      "interventions": [
        {
          "id": "hire",
          "label": "Hire more",
          "to": "staff",
          "polarity": "+",
          "delay": true
        }
      ]
    }
  ],
  "lang": "en"
}
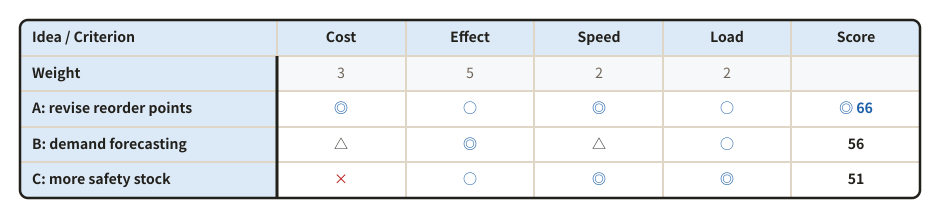
Choosing and preparing

Matrix diagram (evaluation table)

Options against criteria, rated ◎ ○ △ ×. With weights on the criteria, every option gets a score and the best one is marked.

Example of a matrix diagram (evaluation table)
Example prompt

Using svg-diagram, rate three ideas to cut stock-outs by cost, effect, speed and load on the floor, in a weighted matrix.

JSON (the figure as the tool receives it)
{
  "version": 1,
  "title": "Ideas to cut stock-outs",
  "parts": [
    {
      "type": "matrix",
      "corner": "Idea / Criterion",
      "rows": [
        "A: revise reorder points",
        "B: demand forecasting",
        "C: more safety stock"
      ],
      "cols": [
        "Cost",
        "Effect",
        "Speed",
        "Load"
      ],
      "cells": [
        [
          "◎",
          "○",
          "◎",
          "○"
        ],
        [
          "△",
          "◎",
          "△",
          "○"
        ],
        [
          "×",
          "○",
          "◎",
          "◎"
        ]
      ],
      "weights": [
        3,
        5,
        2,
        2
      ]
    }
  ],
  "lang": "en"
}
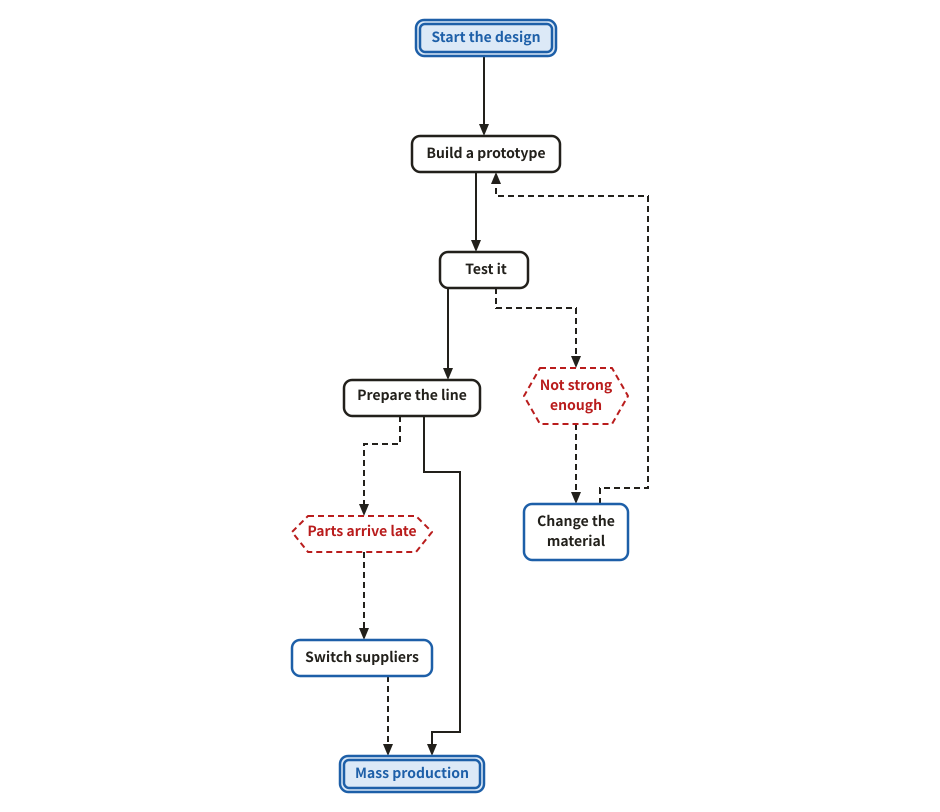
PDPC (process decision program chart)

The steps to a goal, what could go wrong on the way (hexagons) and what to do then, so that the plan has no blind spots.

Example of a pdpc (process decision program chart)
Example prompt

Using svg-diagram, draw a PDPC of our plan to start mass production of a new product, with what we do if the prototype or the parts let us down.

JSON (the figure as the tool receives it)
{
  "version": 1,
  "title": "PDPC to mass production",
  "parts": [
    {
      "type": "pdpc",
      "maxNodeW": 150,
      "nodes": [
        {
          "id": "start",
          "label": "Start the design",
          "role": "start"
        },
        {
          "id": "proto",
          "label": "Build a prototype"
        },
        {
          "id": "test",
          "label": "Test it"
        },
        {
          "id": "line",
          "label": "Prepare the line"
        },
        {
          "id": "goal",
          "label": "Mass production",
          "role": "goal"
        },
        {
          "id": "r1",
          "label": "Not strong enough",
          "role": "risk"
        },
        {
          "id": "m1",
          "label": "Change the material",
          "role": "measure"
        },
        {
          "id": "r2",
          "label": "Parts arrive late",
          "role": "risk"
        },
        {
          "id": "m2",
          "label": "Switch suppliers",
          "role": "measure"
        }
      ],
      "links": [
        {
          "from": "start",
          "to": "proto"
        },
        {
          "from": "proto",
          "to": "test"
        },
        {
          "from": "test",
          "to": "line"
        },
        {
          "from": "line",
          "to": "goal"
        },
        {
          "from": "test",
          "to": "r1"
        },
        {
          "from": "r1",
          "to": "m1"
        },
        {
          "from": "m1",
          "to": "proto"
        },
        {
          "from": "line",
          "to": "r2"
        },
        {
          "from": "r2",
          "to": "m2"
        },
        {
          "from": "m2",
          "to": "goal"
        }
      ]
    }
  ],
  "lang": "en"
}
Strategy

Where you stand, how customers move, what comes first.

Where you stand

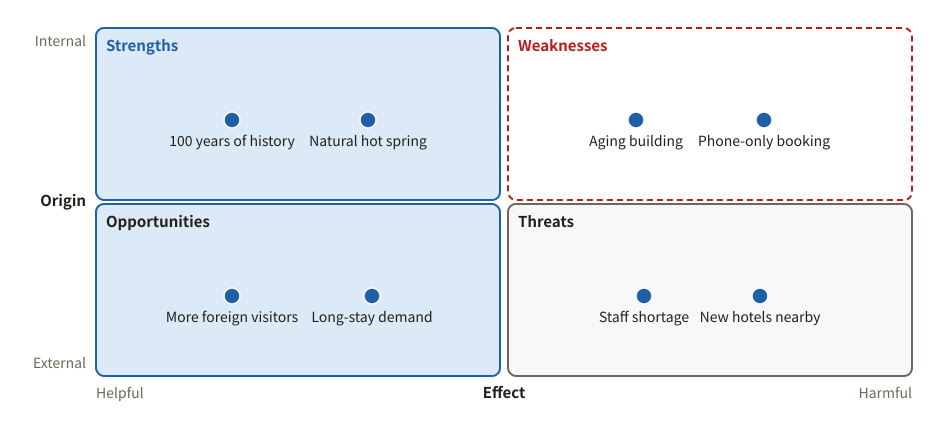
SWOT analysis

A use of the quadrant: internal strengths and weaknesses, external opportunities and threats.

Example of a swot analysis
Example prompt

Using svg-diagram, do a SWOT analysis of a traditional countryside inn, two or three points each.

JSON (the figure as the tool receives it)
{
  "version": 1,
  "title": "SWOT of a traditional inn",
  "parts": [
    {
      "type": "quadrant",
      "x": {
        "title": "Effect",
        "low": "Helpful",
        "high": "Harmful"
      },
      "y": {
        "title": "Origin",
        "low": "External",
        "high": "Internal"
      },
      "cells": [
        [
          {
            "title": "Strengths",
            "tone": "accent"
          },
          {
            "title": "Weaknesses",
            "tone": "danger"
          }
        ],
        [
          {
            "title": "Opportunities",
            "tone": "new"
          },
          {
            "title": "Threats",
            "tone": "muted"
          }
        ]
      ],
      "items": [
        {
          "label": "100 years of history",
          "cell": [
            0,
            0
          ]
        },
        {
          "label": "Natural hot spring",
          "cell": [
            0,
            0
          ]
        },
        {
          "label": "Aging building",
          "cell": [
            1,
            0
          ]
        },
        {
          "label": "Phone-only booking",
          "cell": [
            1,
            0
          ]
        },
        {
          "label": "More foreign visitors",
          "cell": [
            0,
            1
          ]
        },
        {
          "label": "Long-stay demand",
          "cell": [
            0,
            1
          ]
        },
        {
          "label": "Staff shortage",
          "cell": [
            1,
            1
          ]
        },
        {
          "label": "New hotels nearby",
          "cell": [
            1,
            1
          ]
        }
      ]
    }
  ],
  "lang": "en"
}
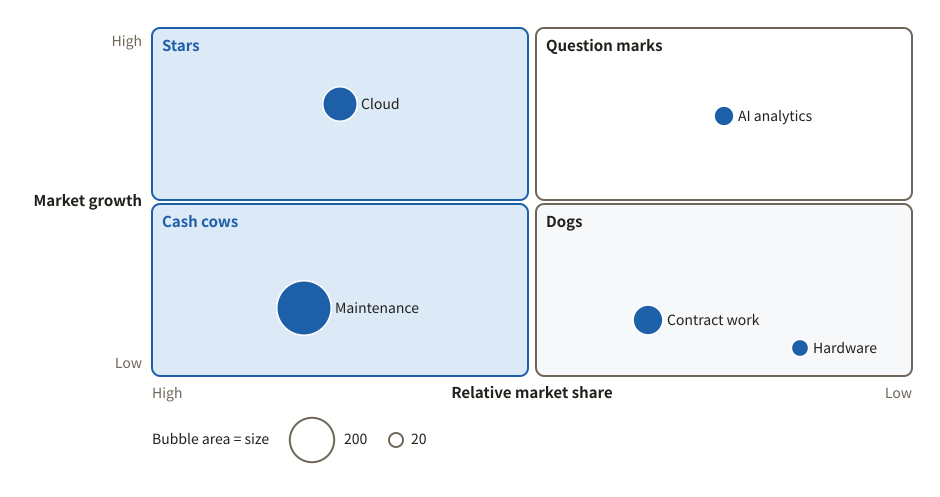
Growth-share matrix (BCG)

Businesses placed by market growth and relative share, with sales as the size of the bubble.

Example of a growth-share matrix (bcg)
Example prompt

Using svg-diagram, place our five businesses on a BCG growth-share matrix, sized by sales.

JSON (the figure as the tool receives it)
{
  "version": 1,
  "title": "Business portfolio",
  "parts": [
    {
      "type": "quadrant",
      "x": {
        "title": "Relative market share",
        "low": "Low",
        "high": "High",
        "reversed": true
      },
      "y": {
        "title": "Market growth",
        "low": "Low",
        "high": "High"
      },
      "cells": [
        [
          {
            "title": "Stars",
            "tone": "accent"
          },
          {
            "title": "Question marks"
          }
        ],
        [
          {
            "title": "Cash cows",
            "tone": "accent"
          },
          {
            "title": "Dogs",
            "tone": "muted"
          }
        ]
      ],
      "items": [
        {
          "label": "Cloud",
          "at": [
            0.75,
            0.85
          ],
          "size": 120
        },
        {
          "label": "Maintenance",
          "at": [
            0.8,
            0.25
          ],
          "size": 300
        },
        {
          "label": "AI analytics",
          "at": [
            0.25,
            0.8
          ],
          "size": 40
        },
        {
          "label": "Contract work",
          "at": [
            0.35,
            0.2
          ],
          "size": 90
        },
        {
          "label": "Hardware",
          "at": [
            0.15,
            0.1
          ],
          "size": 30
        }
      ]
    }
  ],
  "lang": "en"
}
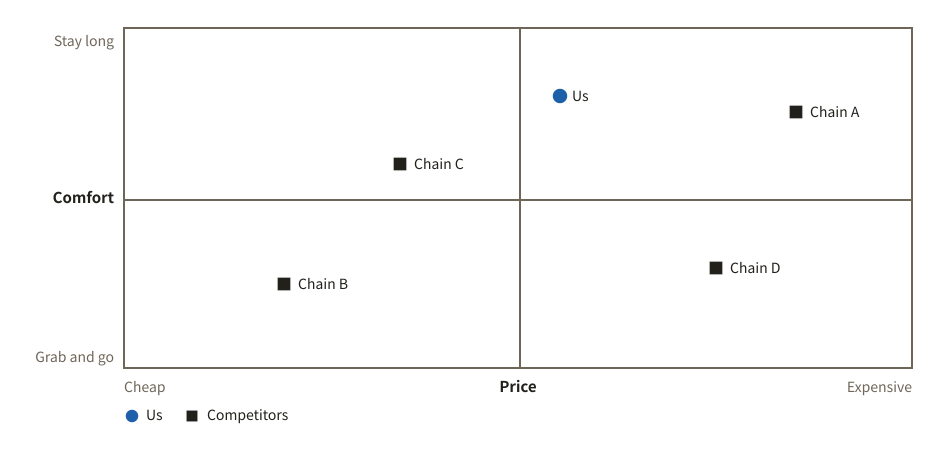
Positioning map

Your company and its competitors on two axes. Each group has its own marker, with a legend.

Example of a positioning map
Example prompt

Using svg-diagram, make a positioning map of five coffee chains on price and comfort, telling us apart from competitors.

JSON (the figure as the tool receives it)
{
  "version": 1,
  "title": "Coffee chain positioning",
  "parts": [
    {
      "type": "quadrant",
      "crosshair": true,
      "x": {
        "title": "Price",
        "low": "Cheap",
        "high": "Expensive"
      },
      "y": {
        "title": "Comfort",
        "low": "Grab and go",
        "high": "Stay long"
      },
      "items": [
        {
          "label": "Us",
          "at": [
            0.55,
            0.8
          ],
          "group": "Us",
          "tone": "accent"
        },
        {
          "label": "Chain A",
          "at": [
            0.85,
            0.75
          ],
          "group": "Competitors"
        },
        {
          "label": "Chain B",
          "at": [
            0.2,
            0.25
          ],
          "group": "Competitors"
        },
        {
          "label": "Chain C",
          "at": [
            0.35,
            0.6
          ],
          "group": "Competitors"
        },
        {
          "label": "Chain D",
          "at": [
            0.75,
            0.3
          ],
          "group": "Competitors"
        }
      ]
    }
  ],
  "lang": "en"
}
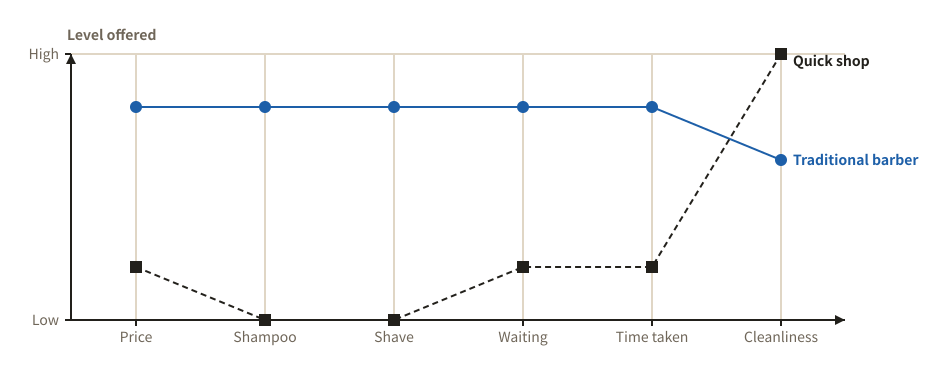
Strategy canvas

The level of value each company offers on each factor of competition, as lines. A tool of Blue Ocean Strategy.

Example of a strategy canvas
Example prompt

Using svg-diagram, draw a strategy canvas comparing a low-price quick haircut shop with a traditional barber.

JSON (the figure as the tool receives it)
{
  "version": 1,
  "title": "Strategy canvas of a quick haircut shop",
  "parts": [
    {
      "type": "strategyCanvas",
      "factors": [
        "Price",
        "Shampoo",
        "Shave",
        "Waiting",
        "Time taken",
        "Cleanliness"
      ],
      "series": [
        {
          "label": "Traditional barber",
          "values": [
            4,
            4,
            4,
            4,
            4,
            3
          ]
        },
        {
          "label": "Quick shop",
          "values": [
            1,
            0,
            0,
            1,
            1,
            5
          ]
        }
      ]
    }
  ],
  "lang": "en"
}
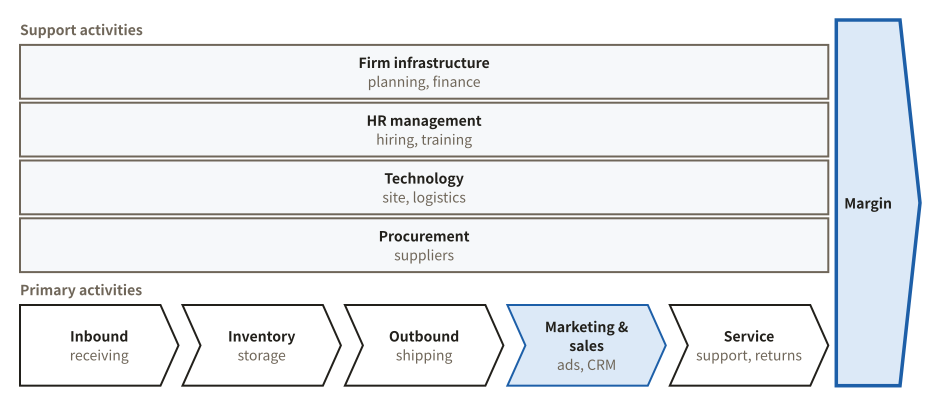
Value chain

Porter's value chain: support and primary activities, to see where value is created.

Example of a value chain
Example prompt

Using svg-diagram, draw the value chain of an e-commerce business, with what each activity covers.

JSON (the figure as the tool receives it)
{
  "version": 1,
  "title": "E-commerce value chain",
  "parts": [
    {
      "type": "valueChain",
      "margin": "Margin",
      "titles": [
        "Support activities",
        "Primary activities"
      ],
      "support": [
        {
          "label": "Firm infrastructure",
          "sub": "planning, finance"
        },
        {
          "label": "HR management",
          "sub": "hiring, training"
        },
        {
          "label": "Technology",
          "sub": "site, logistics"
        },
        {
          "label": "Procurement",
          "sub": "suppliers"
        }
      ],
      "primary": [
        {
          "label": "Inbound",
          "sub": "receiving"
        },
        {
          "label": "Inventory",
          "sub": "storage"
        },
        {
          "label": "Outbound",
          "sub": "shipping"
        },
        {
          "label": "Marketing & sales",
          "sub": "ads, CRM",
          "tone": "accent"
        },
        {
          "label": "Service",
          "sub": "support, returns"
        }
      ]
    }
  ],
  "lang": "en"
}
Customers

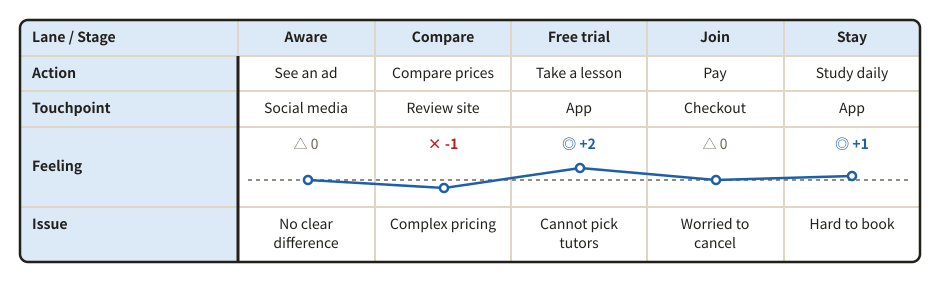
Customer journey map

For each stage a customer goes through: actions, touchpoints, feelings and issues. Feelings are drawn as a curve.

Example of a customer journey map
Example prompt

Using svg-diagram, make a customer journey map for an online English school, from the free trial to staying on, with the ups and downs of feelings.

JSON (the figure as the tool receives it)
{
  "version": 1,
  "title": "Online English school journey",
  "parts": [
    {
      "type": "journeyMap",
      "corner": "Lane / Stage",
      "stages": [
        "Aware",
        "Compare",
        "Free trial",
        "Join",
        "Stay"
      ],
      "lanes": [
        {
          "id": "act",
          "label": "Action",
          "cells": [
            "See an ad",
            "Compare prices",
            "Take a lesson",
            "Pay",
            "Study daily"
          ]
        },
        {
          "id": "touch",
          "label": "Touchpoint",
          "cells": [
            "Social media",
            "Review site",
            "App",
            "Checkout",
            "App"
          ]
        },
        {
          "id": "emotion",
          "label": "Feeling",
          "cells": [
            0,
            -1,
            2,
            0,
            1
          ]
        },
        {
          "id": "issue",
          "label": "Issue",
          "cells": [
            "No clear difference",
            "Complex pricing",
            "Cannot pick tutors",
            "Worried to cancel",
            "Hard to book"
          ]
        }
      ]
    }
  ],
  "lang": "en"
}
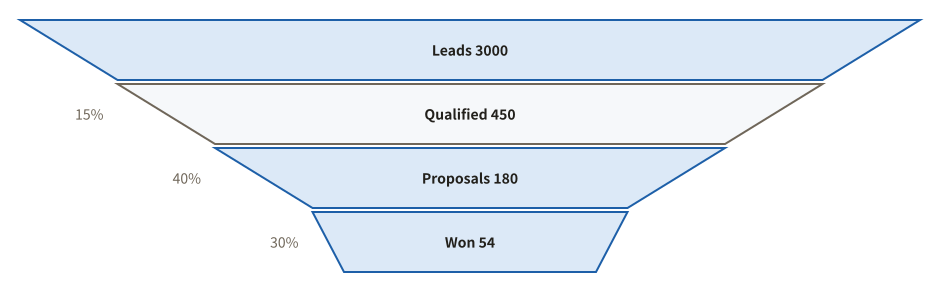
Funnel

Numbers that shrink stage by stage, with the conversion rate between stages.

Example of a funnel
Example prompt

Using svg-diagram, draw a SaaS sales funnel: 3000 leads, 450 qualified, 180 proposals, 54 won, with conversion rates.

JSON (the figure as the tool receives it)
{
  "version": 1,
  "title": "SaaS sales funnel",
  "parts": [
    {
      "type": "funnel",
      "scale": "even",
      "showRate": true,
      "stages": [
        {
          "label": "Leads",
          "value": 3000
        },
        {
          "label": "Qualified",
          "value": 450
        },
        {
          "label": "Proposals",
          "value": 180
        },
        {
          "label": "Won",
          "value": 54,
          "tone": "accent"
        }
      ]
    }
  ],
  "lang": "en"
}
Priorities and comparisons

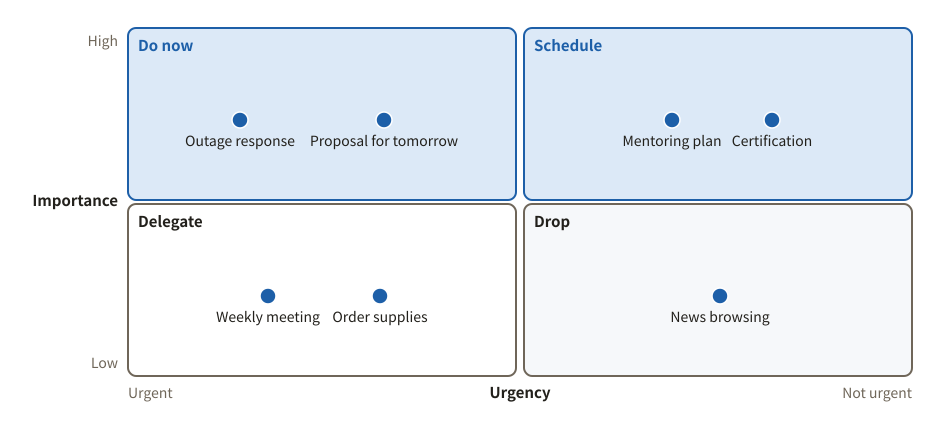
Priority matrix (urgent × important)

The Eisenhower matrix: tasks sorted into four quadrants by urgency and importance.

Example of a priority matrix (urgent × important)
Example prompt

Using svg-diagram, sort this week's tasks into an urgent / important matrix.

JSON (the figure as the tool receives it)
{
  "version": 1,
  "title": "This week's tasks",
  "parts": [
    {
      "type": "quadrant",
      "x": {
        "title": "Urgency",
        "low": "Not urgent",
        "high": "Urgent",
        "reversed": true
      },
      "y": {
        "title": "Importance",
        "low": "Low",
        "high": "High"
      },
      "cells": [
        [
          {
            "title": "Do now",
            "tone": "accent"
          },
          {
            "title": "Schedule",
            "tone": "accent"
          }
        ],
        [
          {
            "title": "Delegate"
          },
          {
            "title": "Drop",
            "tone": "muted"
          }
        ]
      ],
      "items": [
        {
          "label": "Outage response",
          "cell": [
            0,
            0
          ]
        },
        {
          "label": "Proposal for tomorrow",
          "cell": [
            0,
            0
          ]
        },
        {
          "label": "Mentoring plan",
          "cell": [
            1,
            0
          ]
        },
        {
          "label": "Certification",
          "cell": [
            1,
            0
          ]
        },
        {
          "label": "Weekly meeting",
          "cell": [
            0,
            1
          ]
        },
        {
          "label": "Order supplies",
          "cell": [
            0,
            1
          ]
        },
        {
          "label": "News browsing",
          "cell": [
            1,
            1
          ]
        }
      ]
    }
  ],
  "lang": "en"
}

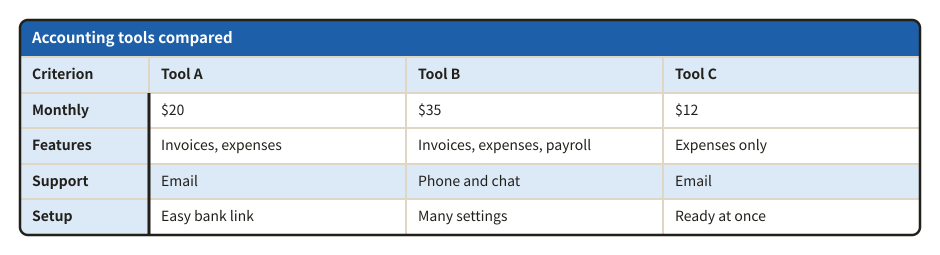
Comparison table

Options side by side, criterion by criterion. Rows can have a heading, and a row can stand out.

Example of a comparison table
Example prompt

Using svg-diagram, compare three accounting tools on price, features, support and ease of setup, as a table.

JSON (the figure as the tool receives it)
{
  "version": 1,
  "title": "Accounting tools",
  "parts": [
    {
      "type": "table",
      "title": "Accounting tools compared",
      "rowHeader": true,
      "columns": [
        {
          "label": "Criterion"
        },
        {
          "label": "Tool A",
          "flex": 2
        },
        {
          "label": "Tool B",
          "flex": 2
        },
        {
          "label": "Tool C",
          "flex": 2
        }
      ],
      "rows": [
        [
          "Monthly",
          "$20",
          "$35",
          "$12"
        ],
        [
          "Features",
          "Invoices, expenses",
          "Invoices, expenses, payroll",
          "Expenses only"
        ],
        {
          "cells": [
            "Support",
            "Email",
            "Phone and chat",
            "Email"
          ],
          "tone": "accent"
        },
        [
          "Setup",
          "Easy bank link",
          "Many settings",
          "Ready at once"
        ]
      ]
    }
  ],
  "lang": "en"
}

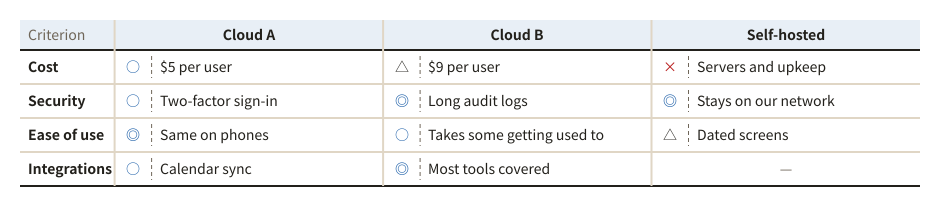
Comparison with reasons (◎○△×)

Options rated ◎ ○ △ × on each criterion, with the reason beside every mark. A cell that is not rated shows a dash.

Example of a comparison with reasons (◎○△×)
Example prompt

Using svg-diagram, compare three team chat options on cost, security, ease of use and integrations, with a reason for each rating.

JSON (the figure as the tool receives it)
{
  "version": 1,
  "title": "Team chat options compared",
  "parts": [
    {
      "type": "compare",
      "corner": "Criterion",
      "rows": [
        "Cost",
        "Security",
        "Ease of use",
        "Integrations"
      ],
      "cols": [
        "Cloud A",
        "Cloud B",
        "Self-hosted"
      ],
      "cells": [
        [
          {
            "mark": "○",
            "note": "$5 per user"
          },
          {
            "mark": "△",
            "note": "$9 per user"
          },
          {
            "mark": "×",
            "note": "Servers and upkeep"
          }
        ],
        [
          {
            "mark": "○",
            "note": "Two-factor sign-in"
          },
          {
            "mark": "◎",
            "note": "Long audit logs"
          },
          {
            "mark": "◎",
            "note": "Stays on our network"
          }
        ],
        [
          {
            "mark": "◎",
            "note": "Same on phones"
          },
          {
            "mark": "○",
            "note": "Takes some getting used to"
          },
          {
            "mark": "△",
            "note": "Dated screens"
          }
        ],
        [
          {
            "mark": "○",
            "note": "Calendar sync"
          },
          {
            "mark": "◎",
            "note": "Most tools covered"
          },
          {
            "mark": "-"
          }
        ]
      ]
    }
  ],
  "lang": "en"
}

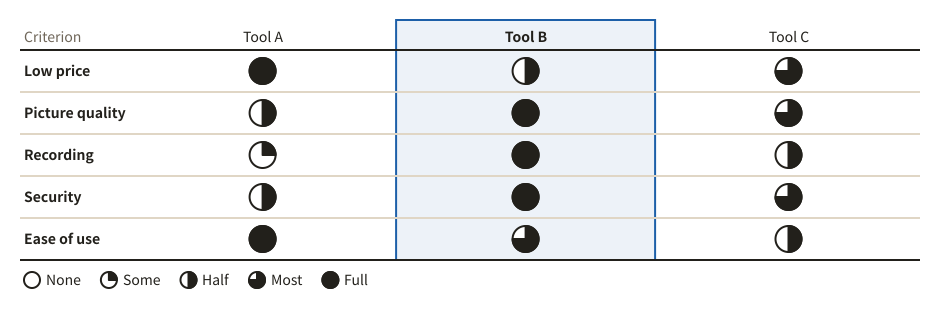
Harvey ball comparison

Options rated with circles filled by quarters, compared at a glance. The legend names the five levels.

Example of a harvey ball comparison
Example prompt

Using svg-diagram, compare three video meeting tools on price, picture quality, recording, security and ease of use as a Harvey ball table.

JSON (the figure as the tool receives it)
{
  "version": 1,
  "title": "Video meeting tools compared",
  "parts": [
    {
      "type": "harvey",
      "corner": "Criterion",
      "rows": [
        "Low price",
        "Picture quality",
        "Recording",
        "Security",
        "Ease of use"
      ],
      "cols": [
        "Tool A",
        "Tool B",
        "Tool C"
      ],
      "highlight": [
        "Tool B"
      ],
      "values": [
        [
          4,
          2,
          3
        ],
        [
          2,
          4,
          3
        ],
        [
          1,
          4,
          2
        ],
        [
          2,
          4,
          3
        ],
        [
          4,
          3,
          2
        ]
      ]
    }
  ],
  "lang": "en"
}

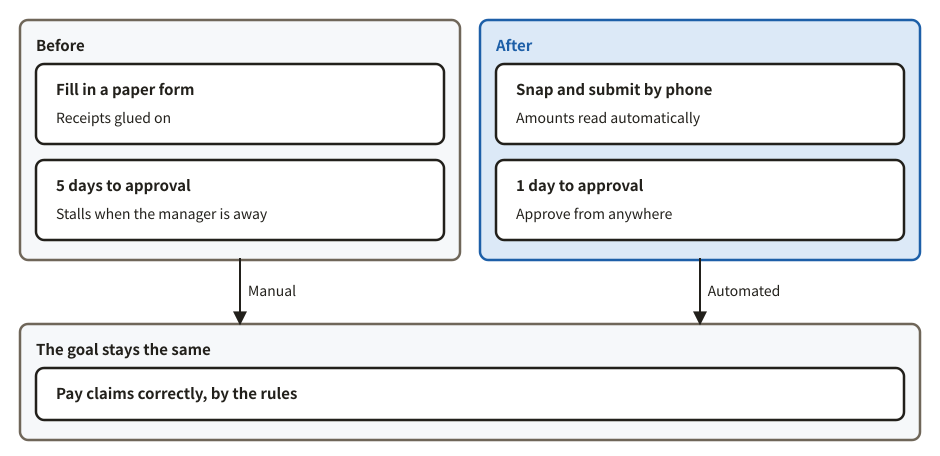
Before and after

Two sides or states in two frames side by side. What both have in common can go in a frame below.

Example of a before and after
Example prompt

Using svg-diagram, compare expense claims before and after we move them to a system, side by side, with the goal both share below.

JSON (the figure as the tool receives it)
{
  "version": 1,
  "title": "Expense claims in a system",
  "parts": [
    {
      "type": "versus",
      "left": {
        "title": "Before",
        "tone": "muted",
        "items": [
          {
            "title": "Fill in a paper form",
            "body": "Receipts glued on"
          },
          {
            "title": "5 days to approval",
            "body": "Stalls when the manager is away"
          }
        ]
      },
      "right": {
        "title": "After",
        "tone": "accent",
        "items": [
          {
            "title": "Snap and submit by phone",
            "body": "Amounts read automatically"
          },
          {
            "title": "1 day to approval",
            "body": "Approve from anywhere"
          }
        ]
      },
      "shared": {
        "title": "The goal stays the same",
        "items": [
          {
            "title": "Pay claims correctly, by the rules"
          }
        ],
        "leftLabel": "Manual",
        "rightLabel": "Automated"
      }
    }
  ],
  "lang": "en"
}

Organizing ideas

Spread ideas out, group them, and show their structure.

Spread and group

Mind map

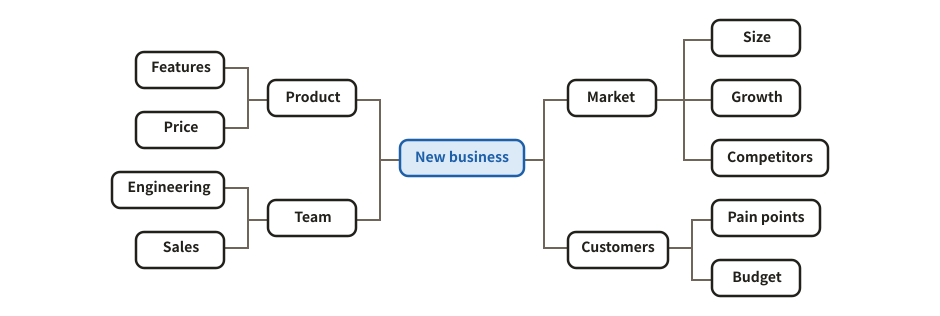
Branches out from a central topic, balanced left and right.

Example of a mind map
Example prompt

Using svg-diagram, organize what to consider for a new business as a mind map with four branches: market, customers, product and team.

JSON (the figure as the tool receives it)
{
  "version": 1,
  "title": "A new business",
  "parts": [
    {
      "type": "mindmap",
      "root": {
        "label": "New business",
        "tone": "accent",
        "children": [
          {
            "label": "Market",
            "children": [
              {
                "label": "Size"
              },
              {
                "label": "Growth"
              },
              {
                "label": "Competitors"
              }
            ]
          },
          {
            "label": "Customers",
            "children": [
              {
                "label": "Pain points"
              },
              {
                "label": "Budget"
              }
            ]
          },
          {
            "label": "Product",
            "children": [
              {
                "label": "Features"
              },
              {
                "label": "Price"
              }
            ]
          },
          {
            "label": "Team",
            "children": [
              {
                "label": "Engineering"
              },
              {
                "label": "Sales"
              }
            ]
          }
        ]
      }
    }
  ],
  "lang": "en"
}

Affinity diagram (KJ method)

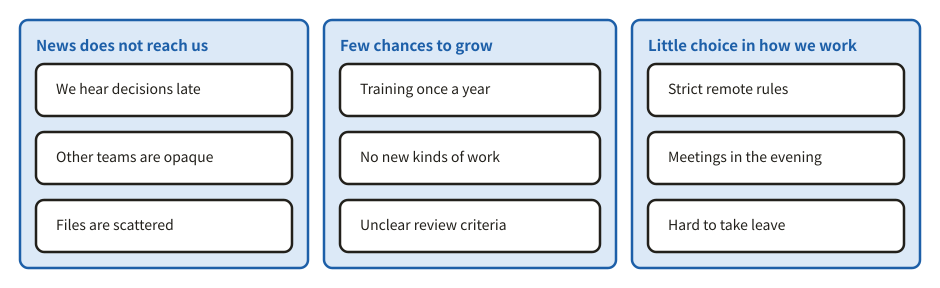
Ideas and facts on cards, gathered into groups of like ones, each group named by one sentence that says what its cards share.

Example of a affinity diagram (kj method)
Example prompt

Using svg-diagram, sort the free answers of our staff survey into an affinity diagram, with a name for each group.

JSON (the figure as the tool receives it)
{
  "version": 1,
  "title": "Staff survey affinity diagram",
  "parts": [
    {
      "type": "affinity",
      "groups": [
        {
          "title": "News does not reach us",
          "cards": [
            "We hear decisions late",
            "Other teams are opaque",
            "Files are scattered"
          ]
        },
        {
          "title": "Few chances to grow",
          "cards": [
            "Training once a year",
            "No new kinds of work",
            "Unclear review criteria"
          ]
        },
        {
          "title": "Little choice in how we work",
          "cards": [
            "Strict remote rules",
            "Meetings in the evening",
            "Hard to take leave"
          ]
        }
      ]
    }
  ],
  "lang": "en"
}

Show the structure

Pyramid

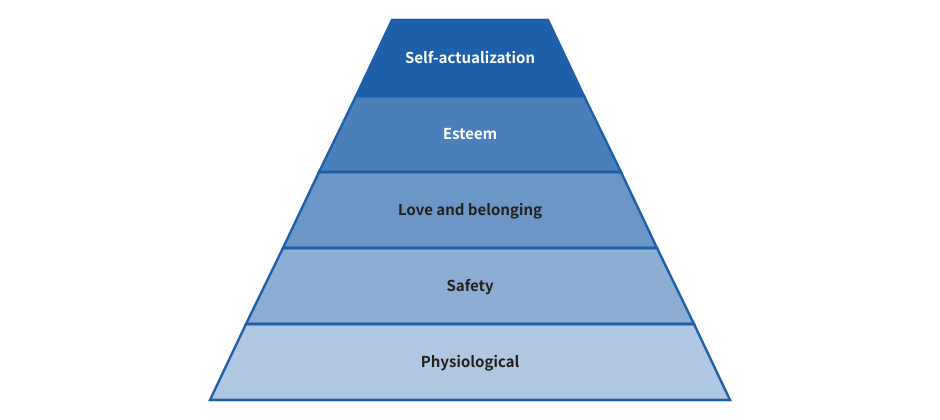
Layers from a wide base to a narrow top, for anything that builds up level by level.

Example of a pyramid
Example prompt

Using svg-diagram, draw Maslow's hierarchy of needs as a pyramid.

JSON (the figure as the tool receives it)
{
  "version": 1,
  "title": "Maslow's hierarchy of needs",
  "parts": [
    {
      "type": "pyramid",
      "layers": [
        "Physiological",
        "Safety",
        "Love and belonging",
        "Esteem",
        "Self-actualization"
      ]
    }
  ],
  "lang": "en"
}

KPI tree (logic tree)

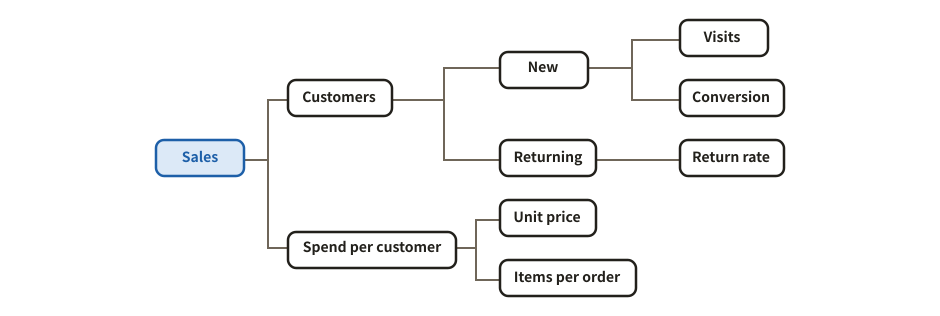
The right layout of a mind map: a goal broken down into its drivers, from left to right.

Example of a kpi tree (logic tree)
Example prompt

Using svg-diagram, break sales down into a KPI tree: customers and spend per customer, and one level below.

JSON (the figure as the tool receives it)
{
  "version": 1,
  "title": "Sales KPI tree",
  "parts": [
    {
      "type": "mindmap",
      "layout": "right",
      "root": {
        "label": "Sales",
        "tone": "accent",
        "children": [
          {
            "label": "Customers",
            "children": [
              {
                "label": "New",
                "children": [
                  {
                    "label": "Visits"
                  },
                  {
                    "label": "Conversion"
                  }
                ]
              },
              {
                "label": "Returning",
                "children": [
                  {
                    "label": "Return rate"
                  }
                ]
              }
            ]
          },
          {
            "label": "Spend per customer",
            "children": [
              {
                "label": "Unit price"
              },
              {
                "label": "Items per order"
              }
            ]
          }
        ]
      }
    }
  ],
  "lang": "en"
}

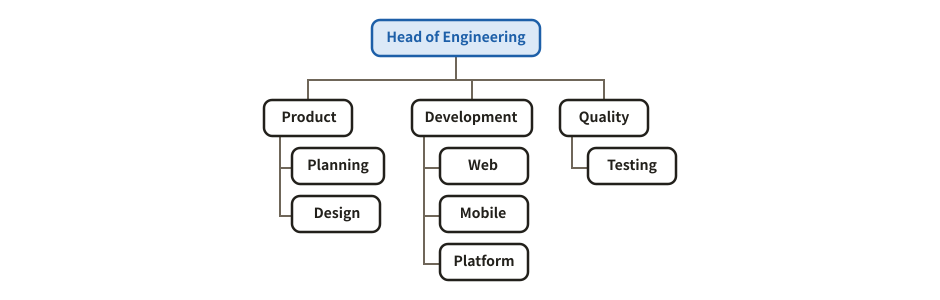
Org chart

The org layout of a mind map: levels from top to bottom.

Example of a org chart
Example prompt

Using svg-diagram, draw an org chart of the engineering division: the head, three departments, and their teams.

JSON (the figure as the tool receives it)
{
  "version": 1,
  "title": "Engineering division",
  "parts": [
    {
      "type": "mindmap",
      "layout": "org",
      "root": {
        "label": "Head of Engineering",
        "tone": "accent",
        "children": [
          {
            "label": "Product",
            "children": [
              {
                "label": "Planning"
              },
              {
                "label": "Design"
              }
            ]
          },
          {
            "label": "Development",
            "children": [
              {
                "label": "Web"
              },
              {
                "label": "Mobile"
              },
              {
                "label": "Platform"
              }
            ]
          },
          {
            "label": "Quality",
            "children": [
              {
                "label": "Testing"
              }
            ]
          }
        ]
      }
    }
  ],
  "lang": "en"
}

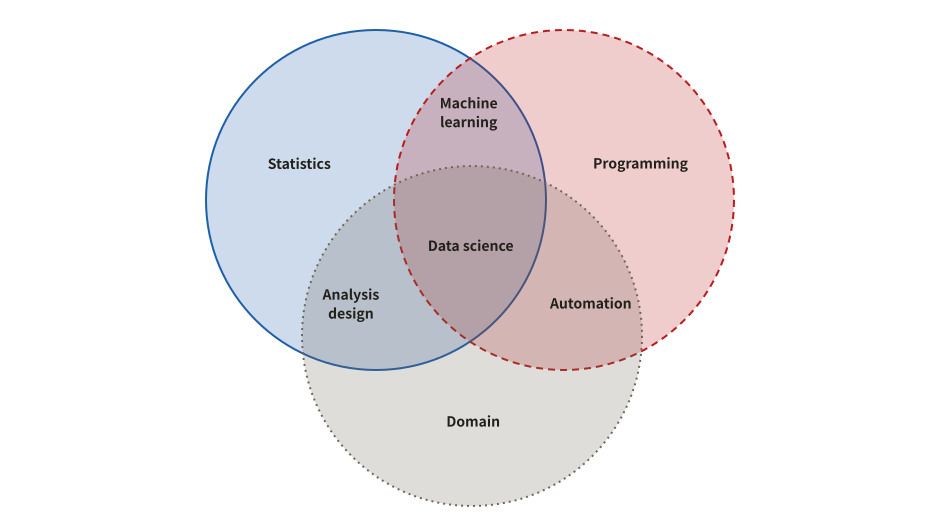
Venn diagram

How two or three sets overlap. The overlaps can be named too.

Example of a venn diagram
Example prompt

Using svg-diagram, draw the skills of a data scientist as a Venn diagram of statistics, programming and domain knowledge.

JSON (the figure as the tool receives it)
{
  "version": 1,
  "title": "Data science skills",
  "parts": [
    {
      "type": "venn",
      "sets": [
        {
          "name": "Statistics"
        },
        {
          "name": "Programming"
        },
        {
          "name": "Domain"
        }
      ],
      "centre": "Data science",
      "overlaps": [
        {
          "sets": [
            "Statistics",
            "Programming"
          ],
          "label": "Machine learning"
        },
        {
          "sets": [
            "Statistics",
            "Domain"
          ],
          "label": "Analysis design"
        },
        {
          "sets": [
            "Programming",
            "Domain"
          ],
          "label": "Automation"
        }
      ]
    }
  ],
  "lang": "en"
}
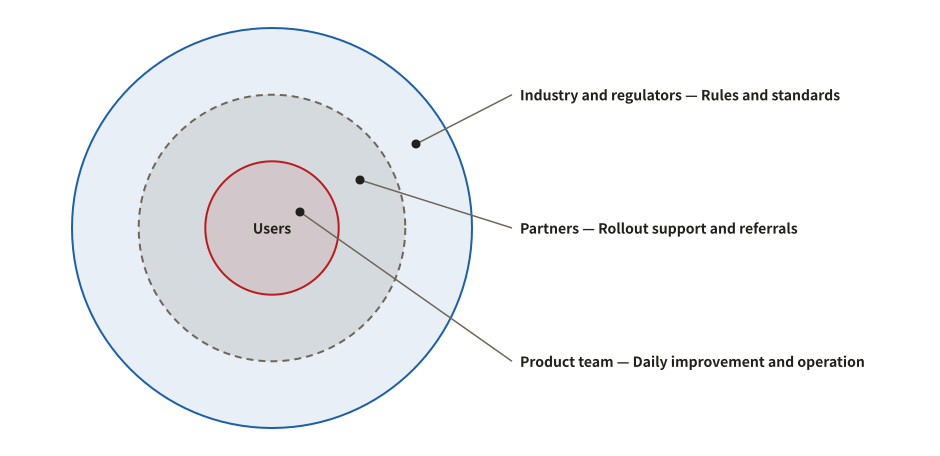
Concentric circles

Layers around a centre, showing how close each group is, or layers of defence. Names and descriptions can sit beside the circles.

Example of a concentric circles
Example prompt

Using svg-diagram, draw the stakeholders of our service as concentric circles, closest first, with a description for each ring.

JSON (the figure as the tool receives it)
{
  "version": 1,
  "title": "Stakeholders of the service",
  "parts": [
    {
      "type": "concentric",
      "order": "inner-first",
      "labels": "side",
      "centre": "Users",
      "rings": [
        {
          "label": "Product team",
          "description": "Daily improvement and operation"
        },
        {
          "label": "Partners",
          "description": "Rollout support and referrals"
        },
        {
          "label": "Industry and regulators",
          "description": "Rules and standards"
        }
      ]
    }
  ],
  "lang": "en"
}
Charts

Numbers to compare, follow over time, break down, or spread out.

Comparing amounts

Bar chart

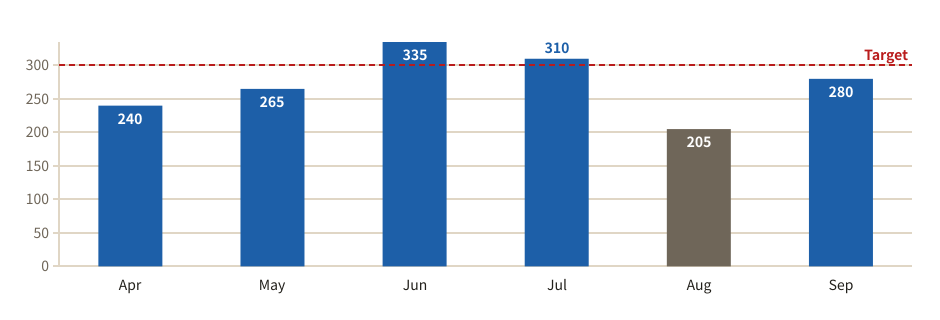
Compares amounts by the length of their bars. A reference line such as a target can be drawn, and bars can be singled out by colour.

Example of a bar chart
Example prompt

Using svg-diagram, make a bar chart of support inquiries per month this fiscal year. Draw a line at the target of 300 and highlight the months above it.

JSON (the figure as the tool receives it)
{
  "version": 1,
  "title": "Support inquiries per month",
  "parts": [
    {
      "type": "bars",
      "dir": "v",
      "data": [
        {
          "label": "Apr",
          "value": 240
        },
        {
          "label": "May",
          "value": 265
        },
        {
          "label": "Jun",
          "value": 335,
          "tone": "accent"
        },
        {
          "label": "Jul",
          "value": 310,
          "tone": "accent"
        },
        {
          "label": "Aug",
          "value": 205,
          "tone": "muted"
        },
        {
          "label": "Sep",
          "value": 280
        }
      ],
      "lines": [
        {
          "at": 300,
          "label": "Target"
        }
      ]
    }
  ],
  "lang": "en"
}
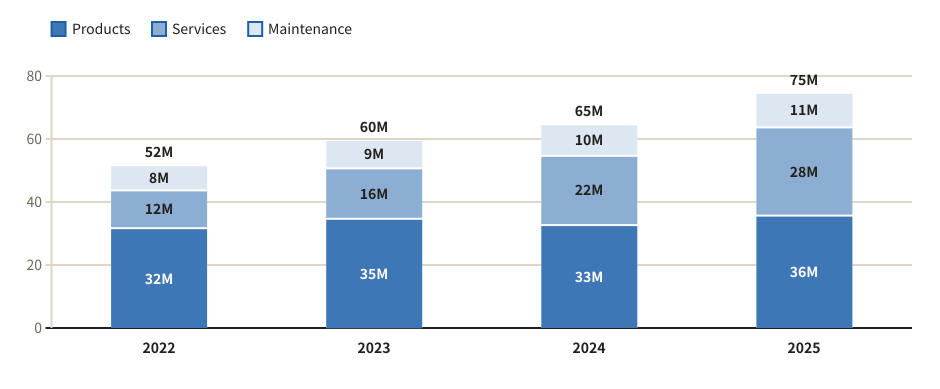
Stacked bar chart

Shows a total and its make-up at once. As 100% columns it compares the shares instead of the sizes.

Example of a stacked bar chart
Example prompt

Using svg-diagram, make a stacked bar chart of our revenue over the last four years, split into products, services and maintenance.

JSON (the figure as the tool receives it)
{
  "version": 1,
  "title": "Revenue by line of business",
  "parts": [
    {
      "type": "stackedBars",
      "unit": "M",
      "series": [
        "Products",
        "Services",
        "Maintenance"
      ],
      "columns": [
        {
          "label": "2022",
          "values": [
            32,
            12,
            8
          ]
        },
        {
          "label": "2023",
          "values": [
            35,
            16,
            9
          ]
        },
        {
          "label": "2024",
          "values": [
            33,
            22,
            10
          ]
        },
        {
          "label": "2025",
          "values": [
            36,
            28,
            11
          ]
        }
      ]
    }
  ],
  "lang": "en"
}
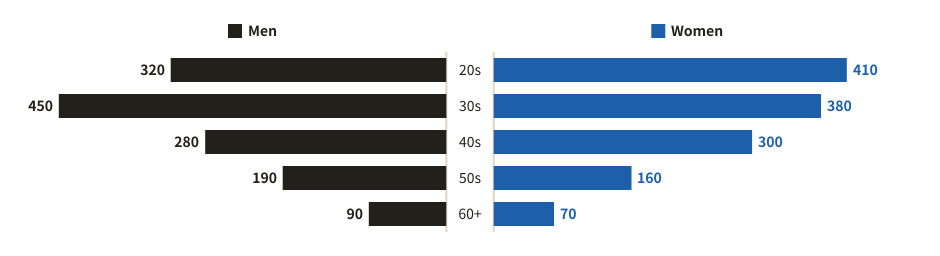
Butterfly chart

Two groups compared row by row, with bars running left and right from the labels in the middle.

Example of a butterfly chart
Example prompt

Using svg-diagram, draw our members by age group as a butterfly chart, men on the left and women on the right.

JSON (the figure as the tool receives it)
{
  "version": 1,
  "title": "Members by age group",
  "parts": [
    {
      "type": "butterfly",
      "leftLabel": "Men",
      "rightLabel": "Women",
      "rows": [
        {
          "label": "20s",
          "left": 320,
          "right": 410
        },
        {
          "label": "30s",
          "left": 450,
          "right": 380
        },
        {
          "label": "40s",
          "left": 280,
          "right": 300
        },
        {
          "label": "50s",
          "left": 190,
          "right": 160
        },
        {
          "label": "60+",
          "left": 90,
          "right": 70
        }
      ]
    }
  ],
  "lang": "en"
}
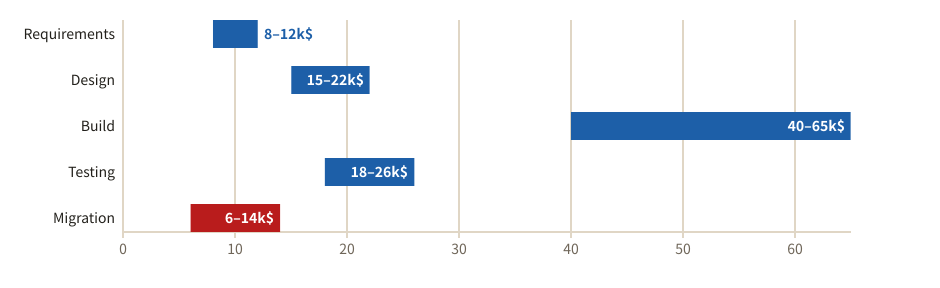
Range bars

Shows a range from a low to a high value per item, such as an estimate or a price band. The widest ranges stand out at once.

Example of a range bars
Example prompt

Using svg-diagram, draw range bars of the cost estimate of each phase of a software project, from the optimistic to the pessimistic figure.

JSON (the figure as the tool receives it)
{
  "version": 1,
  "title": "Estimate range by phase",
  "parts": [
    {
      "type": "rangeBars",
      "unit": "k$",
      "items": [
        {
          "label": "Requirements",
          "low": 8,
          "high": 12
        },
        {
          "label": "Design",
          "low": 15,
          "high": 22
        },
        {
          "label": "Build",
          "low": 40,
          "high": 65,
          "tone": "accent"
        },
        {
          "label": "Testing",
          "low": 18,
          "high": 26
        },
        {
          "label": "Migration",
          "low": 6,
          "high": 14,
          "tone": "danger"
        }
      ]
    }
  ],
  "lang": "en"
}
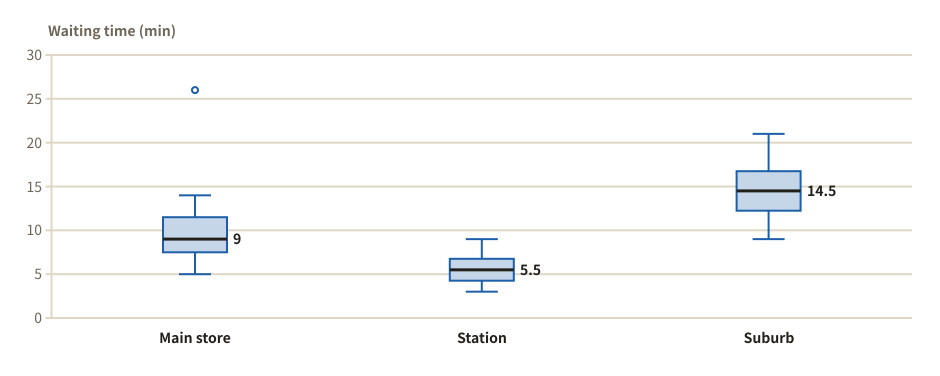
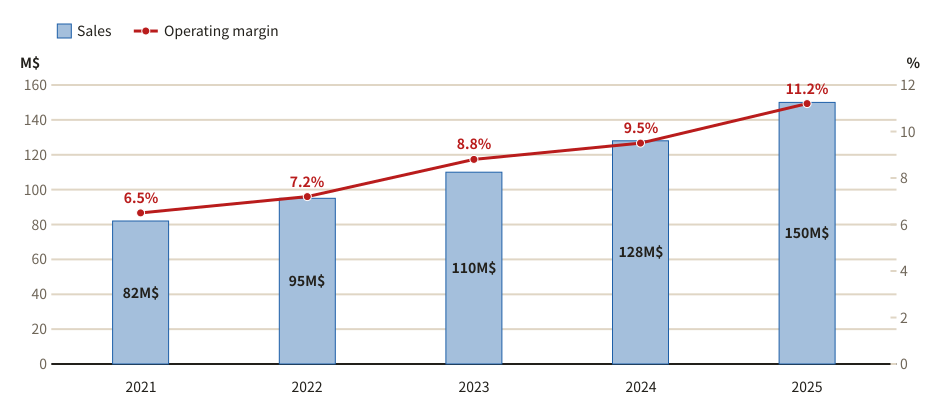
Combo chart (bars and line)

Amounts as bars and a rate as a line, each on its own axis, in one chart.

Example of a combo chart (bars and line)
Example prompt

Using svg-diagram, draw a combo chart of the last five years: sales (M$) as bars and operating margin (%) as a line.

JSON (the figure as the tool receives it)
{
  "version": 1,
  "title": "Sales and operating margin",
  "parts": [
    {
      "type": "combo",
      "categories": [
        "2021",
        "2022",
        "2023",
        "2024",
        "2025"
      ],
      "series": [
        {
          "label": "Sales",
          "type": "bar",
          "values": [
            82,
            95,
            110,
            128,
            150
          ]
        },
        {
          "label": "Operating margin",
          "type": "line",
          "values": [
            6.5,
            7.2,
            8.8,
            9.5,
            11.2
          ]
        }
      ],
      "y": {
        "unit": "M$",
        "min": 0
      },
      "y2": {
        "unit": "%",
        "min": 0
      }
    }
  ],
  "lang": "en"
}

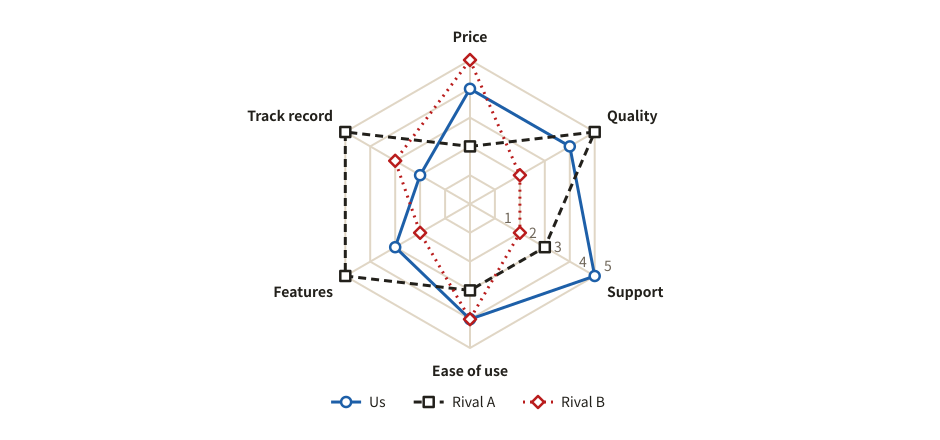
Radar chart

Puts scores on several criteria on axes around a centre, so profiles can be compared by their shape. Strengths and weaknesses show at a glance.

Example of a radar chart
Example prompt

Using svg-diagram, make a radar chart rating our product and two competitors from 1 to 5 on price, quality, support, ease of use, features and track record.

JSON (the figure as the tool receives it)
{
  "version": 1,
  "title": "Product comparison (1-5)",
  "parts": [
    {
      "type": "radar",
      "max": 5,
      "axes": [
        "Price",
        "Quality",
        "Support",
        "Ease of use",
        "Features",
        "Track record"
      ],
      "series": [
        {
          "label": "Us",
          "values": [
            4,
            4,
            5,
            4,
            3,
            2
          ]
        },
        {
          "label": "Rival A",
          "values": [
            2,
            5,
            3,
            3,
            5,
            5
          ]
        },
        {
          "label": "Rival B",
          "values": [
            5,
            2,
            2,
            4,
            2,
            3
          ]
        }
      ]
    }
  ],
  "lang": "en"
}
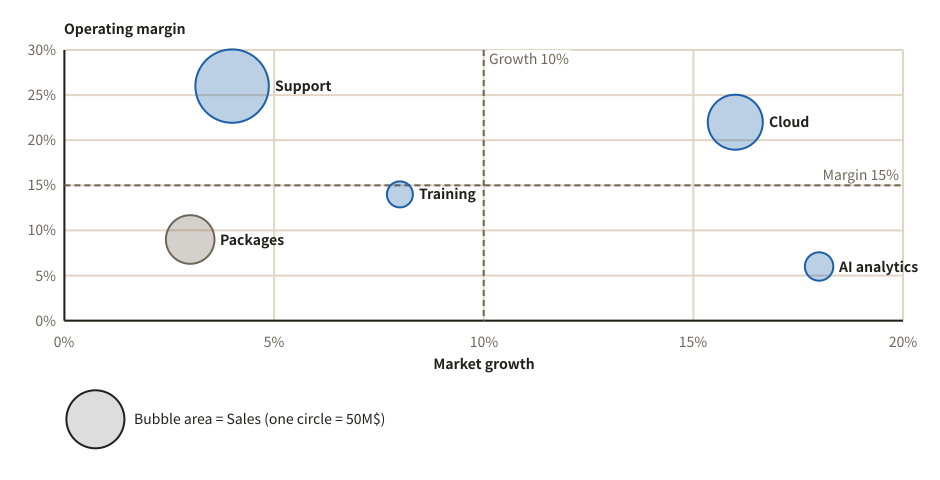
Change over time

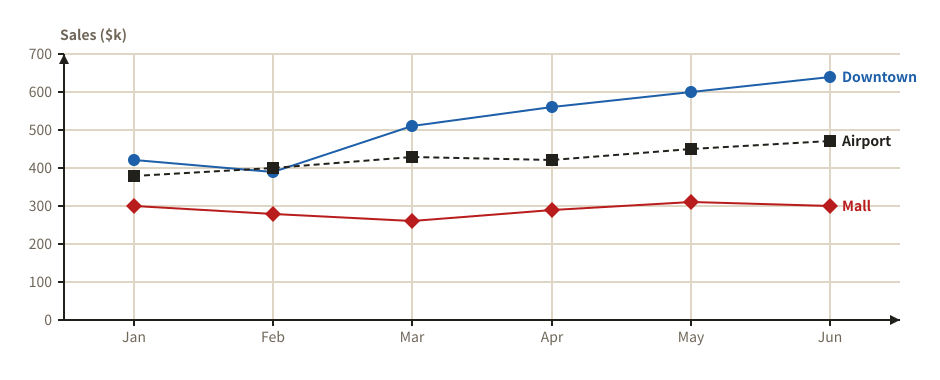
Line chart

Shows how values change over time as lines. Several series can be compared, and a plan line (dashed) or a target line can be added.

Example of a line chart
Example prompt

Using svg-diagram, make a line chart of monthly sales of our three stores in the first half of this year.

JSON (the figure as the tool receives it)
{
  "version": 1,
  "title": "Monthly sales by store",
  "parts": [
    {
      "type": "lines",
      "categories": [
        "Jan",
        "Feb",
        "Mar",
        "Apr",
        "May",
        "Jun"
      ],
      "yLabel": "Sales ($k)",
      "series": [
        {
          "label": "Downtown",
          "values": [
            420,
            390,
            510,
            560,
            600,
            640
          ]
        },
        {
          "label": "Airport",
          "values": [
            380,
            400,
            430,
            420,
            450,
            470
          ]
        },
        {
          "label": "Mall",
          "values": [
            300,
            280,
            260,
            290,
            310,
            300
          ]
        }
      ]
    }
  ],
  "lang": "en"
}
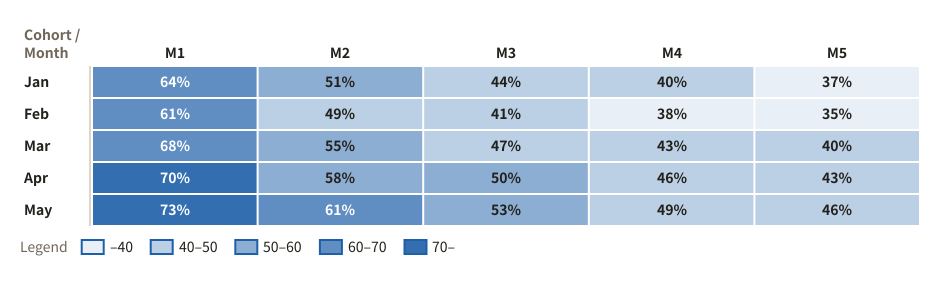
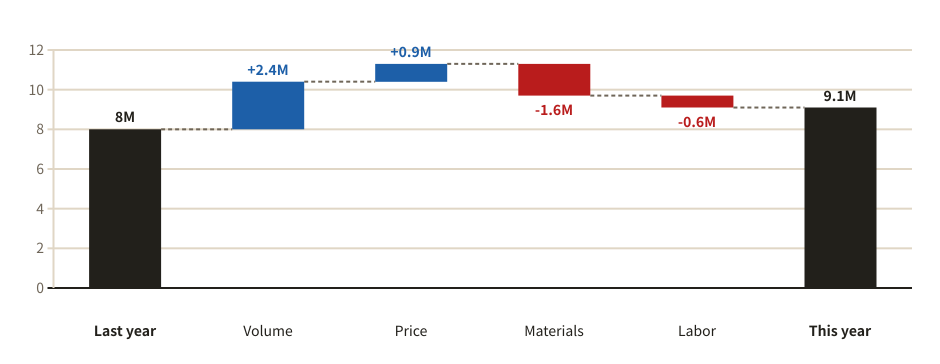
Waterfall chart

Steps from a starting amount to an ending one, showing what added how much and what took away. Good for explaining a change in profit.

Example of a waterfall chart
Example prompt

Using svg-diagram, explain with a waterfall chart why operating profit went from $8.0M last year to $9.1M this year.

JSON (the figure as the tool receives it)
{
  "version": 1,
  "title": "Operating profit bridge",
  "parts": [
    {
      "type": "waterfall",
      "unit": "M",
      "steps": [
        {
          "label": "Last year",
          "value": 8
        },
        {
          "label": "Volume",
          "value": 2.4
        },
        {
          "label": "Price",
          "value": 0.9
        },
        {
          "label": "Materials",
          "value": -1.6
        },
        {
          "label": "Labor",
          "value": -0.6
        },
        {
          "label": "This year",
          "kind": "total"
        }
      ]
    }
  ],
  "lang": "en"
}
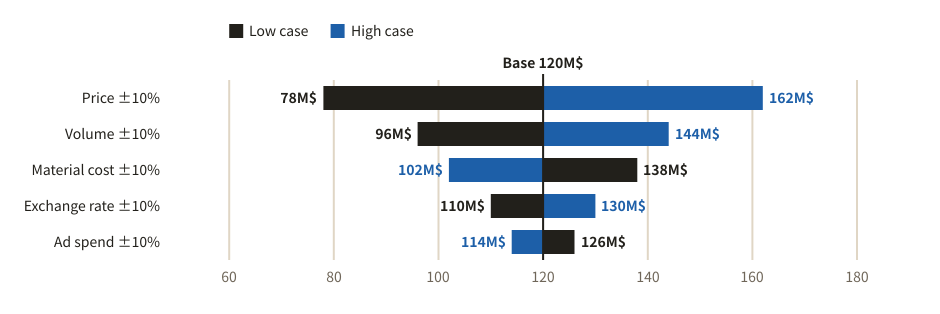
Shares and flows

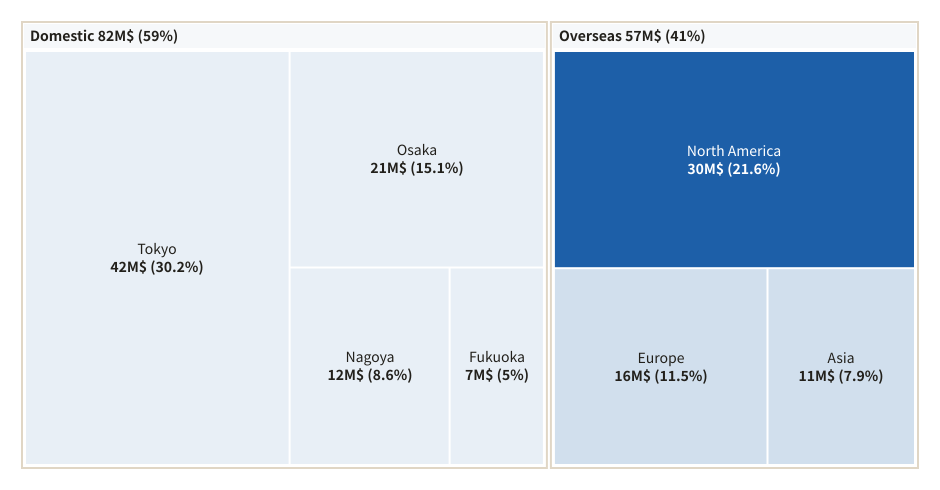
Treemap

Shares of a whole as areas, with the breakdown inside each group on the same page.

Example of a treemap
Example prompt

Using svg-diagram, draw a treemap of our sales by region and city. Highlight North America, which grows the fastest.

JSON (the figure as the tool receives it)
{
  "version": 1,
  "title": "Sales by region",
  "parts": [
    {
      "type": "treemap",
      "unit": "M$",
      "percent": true,
      "items": [
        {
          "label": "Domestic",
          "children": [
            {
              "label": "Tokyo",
              "value": 42
            },
            {
              "label": "Osaka",
              "value": 21
            },
            {
              "label": "Nagoya",
              "value": 12
            },
            {
              "label": "Fukuoka",
              "value": 7
            }
          ]
        },
        {
          "label": "Overseas",
          "children": [
            {
              "label": "North America",
              "value": 30,
              "tone": "accent"
            },
            {
              "label": "Europe",
              "value": 16
            },
            {
              "label": "Asia",
              "value": 11
            }
          ]
        }
      ]
    }
  ],
  "lang": "en"
}
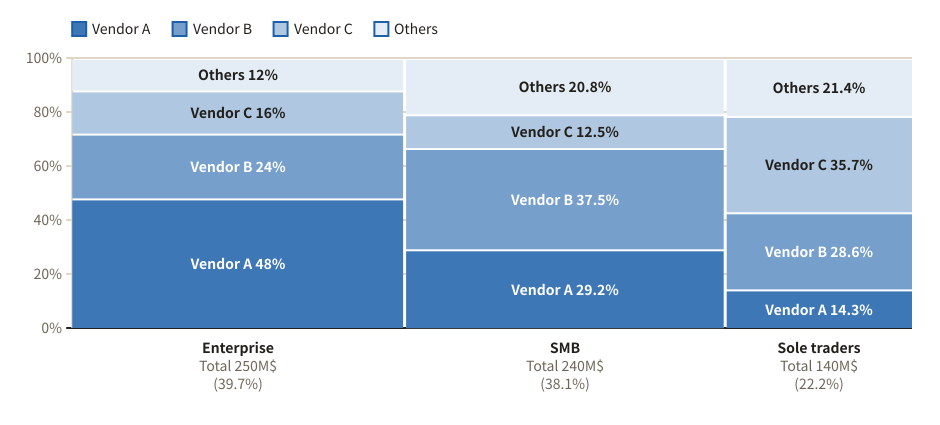
Mekko chart

The width of a column is the size of a market and the height a share, so each area is its share of the whole.

Example of a mekko chart
Example prompt

Using svg-diagram, draw the accounting software market by large companies, small businesses and sole traders, with each vendor's share, as a Mekko chart.

JSON (the figure as the tool receives it)
{
  "version": 1,
  "title": "Accounting software market share",
  "parts": [
    {
      "type": "mekko",
      "unit": "M$",
      "series": [
        "Vendor A",
        "Vendor B",
        "Vendor C",
        "Others"
      ],
      "columns": [
        {
          "label": "Enterprise",
          "values": [
            120,
            60,
            40,
            30
          ]
        },
        {
          "label": "SMB",
          "values": [
            70,
            90,
            30,
            50
          ]
        },
        {
          "label": "Sole traders",
          "values": [
            20,
            40,
            50,
            30
          ]
        }
      ]
    }
  ],
  "lang": "en"
}
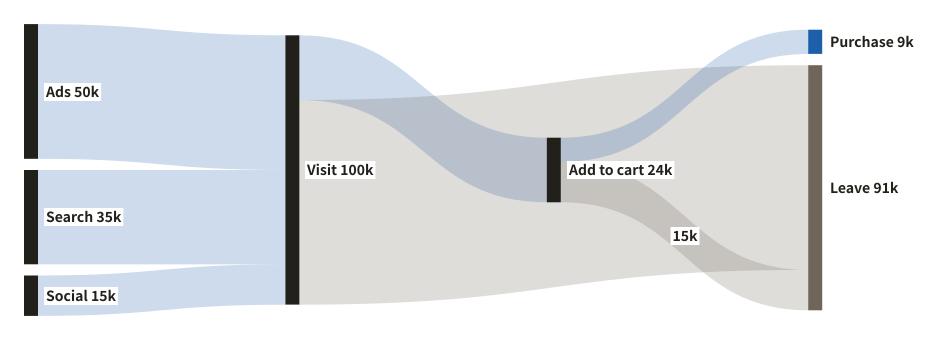
Sankey diagram

Flows of an amount, drawn as ribbons as thick as the flow. Shows at a glance where visitors come from, where they drop out and how many convert.

Example of a sankey diagram
Example prompt

Using svg-diagram, draw a Sankey diagram of the visitors to our online shop: where they come from, where they leave and how many buy.

JSON (the figure as the tool receives it)
{
  "version": 1,
  "title": "From visit to purchase",
  "parts": [
    {
      "type": "sankey",
      "unit": "k",
      "nodes": [
        {
          "id": "ad",
          "label": "Ads"
        },
        {
          "id": "seo",
          "label": "Search"
        },
        {
          "id": "sns",
          "label": "Social"
        },
        {
          "id": "visit",
          "label": "Visit"
        },
        {
          "id": "cart",
          "label": "Add to cart"
        },
        {
          "id": "buy",
          "label": "Purchase",
          "tone": "accent"
        },
        {
          "id": "leave",
          "label": "Leave",
          "tone": "muted"
        }
      ],
      "links": [
        {
          "from": "ad",
          "to": "visit",
          "value": 50
        },
        {
          "from": "seo",
          "to": "visit",
          "value": 35
        },
        {
          "from": "sns",
          "to": "visit",
          "value": 15
        },
        {
          "from": "visit",
          "to": "cart",
          "value": 24
        },
        {
          "from": "visit",
          "to": "leave",
          "value": 76,
          "tone": "muted"
        },
        {
          "from": "cart",
          "to": "buy",
          "value": 9,
          "tone": "accent"
        },
        {
          "from": "cart",
          "to": "leave",
          "value": 15,
          "tone": "muted"
        }
      ]
    }
  ],
  "lang": "en"
}
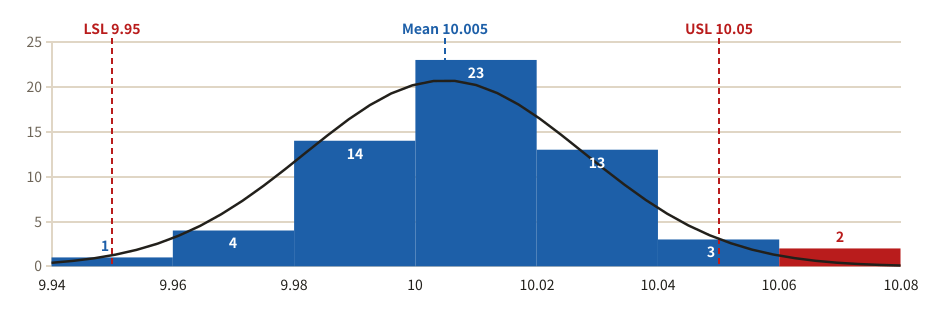
Spread and relationships

Box plot

Compares the spread of values between groups: a box from the first to the third quartile, whiskers, and the outliers as rings.

Example of a box plot
Example prompt

Using svg-diagram, compare the checkout waiting times of three stores with a box plot.

JSON (the figure as the tool receives it)
{
  "version": 1,
  "title": "Checkout waiting time by store",
  "parts": [
    {
      "type": "boxplot",
      "label": "Waiting time (min)",
      "values": "median",
      "groups": [
        {
          "label": "Main store",
          "values": [
            5,
            6,
            7,
            8,
            8,
            9,
            10,
            11,
            12,
            14,
            26
          ]
        },
        {
          "label": "Station",
          "values": [
            3,
            4,
            4,
            5,
            5,
            6,
            6,
            7,
            8,
            9
          ]
        },
        {
          "label": "Suburb",
          "values": [
            9,
            10,
            12,
            13,
            14,
            15,
            16,
            17,
            19,
            21
          ]
        }
      ]
    }
  ],
  "lang": "en"
}
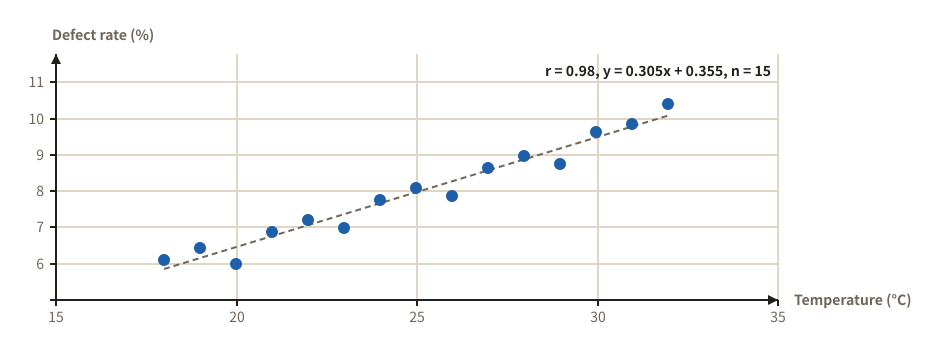
Bubble chart

Items placed by two measures, with a circle whose area is a third. Threshold lines split the plot into four areas.

Example of a bubble chart
Example prompt

Using svg-diagram, draw a bubble chart of our products by market growth and operating margin, with sales as the size of the circles.

JSON (the figure as the tool receives it)
{
  "version": 1,
  "title": "Product portfolio",
  "parts": [
    {
      "type": "bubble",
      "sizeTitle": "Sales",
      "sizeUnit": "M$",
      "x": {
        "title": "Market growth",
        "unit": "%",
        "min": 0,
        "max": 20,
        "line": 10,
        "lineLabel": "Growth 10%"
      },
      "y": {
        "title": "Operating margin",
        "unit": "%",
        "min": 0,
        "max": 30,
        "line": 15,
        "lineLabel": "Margin 15%"
      },
      "points": [
        {
          "label": "Cloud",
          "x": 16,
          "y": 22,
          "size": 45,
          "tone": "accent"
        },
        {
          "label": "Support",
          "x": 4,
          "y": 26,
          "size": 80
        },
        {
          "label": "Packages",
          "x": 3,
          "y": 9,
          "size": 35,
          "tone": "muted"
        },
        {
          "label": "AI analytics",
          "x": 18,
          "y": 6,
          "size": 12
        },
        {
          "label": "Training",
          "x": 8,
          "y": 14,
          "size": 10
        }
      ]
    }
  ],
  "lang": "en"
}
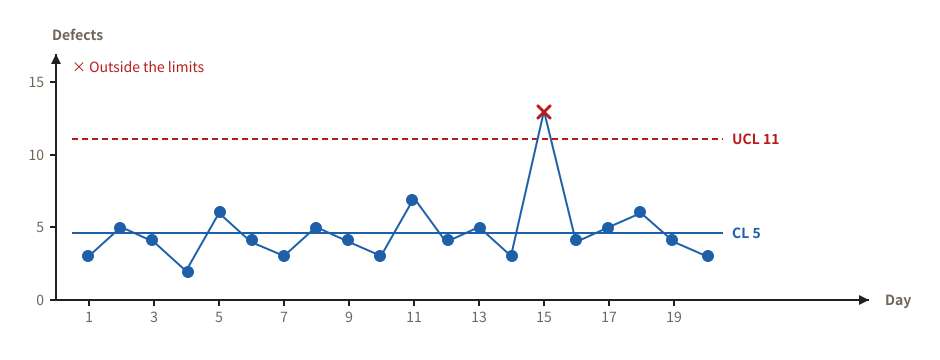
Heatmap

A table of numbers shaded by size. Good for cohort retention, or for comparing days and hours.

Example of a heatmap
Example prompt

Using svg-diagram, draw a cohort heatmap of member retention, by month of sign-up and months since.

JSON (the figure as the tool receives it)
{
  "version": 1,
  "title": "Retention by sign-up month",
  "parts": [
    {
      "type": "heatmap",
      "unit": "%",
      "corner": "Cohort / Month",
      "rows": [
        "Jan",
        "Feb",
        "Mar",
        "Apr",
        "May"
      ],
      "cols": [
        "M1",
        "M2",
        "M3",
        "M4",
        "M5"
      ],
      "values": [
        [
          64,
          51,
          44,
          40,
          37
        ],
        [
          61,
          49,
          41,
          38,
          35
        ],
        [
          68,
          55,
          47,
          43,
          40
        ],
        [
          70,
          58,
          50,
          46,
          43
        ],
        [
          73,
          61,
          53,
          49,
          46
        ]
      ]
    }
  ],
  "lang": "en"
}
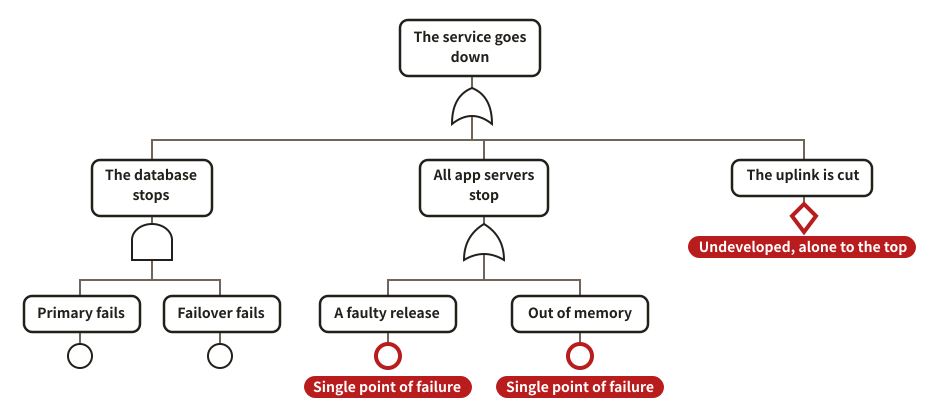
Tornado chart (sensitivity)

How far a result moves when each assumption changes, the largest effect first. Shows which assumptions to pin down.

Example of a tornado chart (sensitivity)
Example prompt

Using svg-diagram, draw a tornado chart of how our new product's operating profit moves when price, volume, material cost, exchange rate and ad spend each change by ±10%.

JSON (the figure as the tool receives it)
{
  "version": 1,
  "title": "Sensitivity of operating profit",
  "parts": [
    {
      "type": "tornado",
      "base": 120,
      "unit": "M$",
      "items": [
        {
          "label": "Price ±10%",
          "low": 78,
          "high": 162
        },
        {
          "label": "Volume ±10%",
          "low": 96,
          "high": 144
        },
        {
          "label": "Material cost ±10%",
          "low": 138,
          "high": 102
        },
        {
          "label": "Exchange rate ±10%",
          "low": 110,
          "high": 130
        },
        {
          "label": "Ad spend ±10%",
          "low": 126,
          "high": 114
        }
      ]
    }
  ],
  "lang": "en"
}
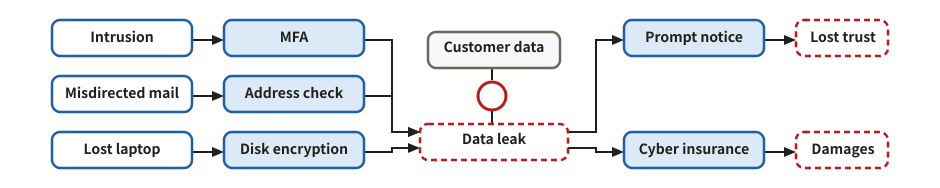
Quality and risk

Manage quality with data, and prepare for what could fail.

The seven QC tools

Pareto chart

Sorts causes from the most frequent down and overlays the cumulative share, so the vital few that make up 80% stand out in colour.

Example of a pareto chart
Example prompt

Using svg-diagram, make a Pareto chart of last month's defects: scratches 48, stains 31, chips 15, wrong size 9, uneven color 6, foreign matter 4, other 3.

JSON (the figure as the tool receives it)
{
  "version": 1,
  "title": "Last month's defects",
  "parts": [
    {
      "type": "pareto",
      "items": [
        {
          "label": "Scratch",
          "value": 48
        },
        {
          "label": "Stain",
          "value": 31
        },
        {
          "label": "Chip",
          "value": 15
        },
        {
          "label": "Wrong size",
          "value": 9
        },
        {
          "label": "Uneven color",
          "value": 6
        },
        {
          "label": "Foreign matter",
          "value": 4
        },
        {
          "label": "Other",
          "value": 3
        }
      ]
    }
  ],
  "lang": "en"
}
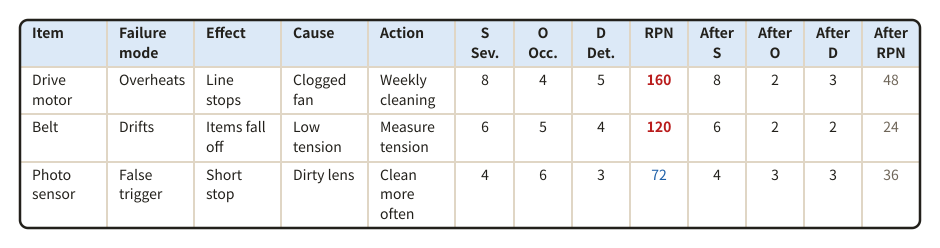
Check sheet

Counts defects by kind and by day or machine, with a row and a column of totals.

Example of a check sheet
Example prompt

Using svg-diagram, make a check sheet of this week's defects, counted by kind and by weekday.

JSON (the figure as the tool receives it)
{
  "version": 1,
  "title": "This week's defect check sheet",
  "parts": [
    {
      "type": "checkSheet",
      "corner": "Defect",
      "columns": [
        "Mon",
        "Tue",
        "Wed",
        "Thu",
        "Fri"
      ],
      "items": [
        {
          "label": "Scratch",
          "counts": [
            3,
            5,
            2,
            4,
            6
          ]
        },
        {
          "label": "Stain",
          "counts": [
            1,
            0,
            4,
            2,
            1
          ]
        },
        {
          "label": "Chip",
          "counts": [
            0,
            2,
            1,
            0,
            3
          ]
        },
        {
          "label": "Wrong size",
          "counts": [
            2,
            1,
            0,
            1,
            0
          ]
        }
      ]
    }
  ],
  "lang": "en"
}
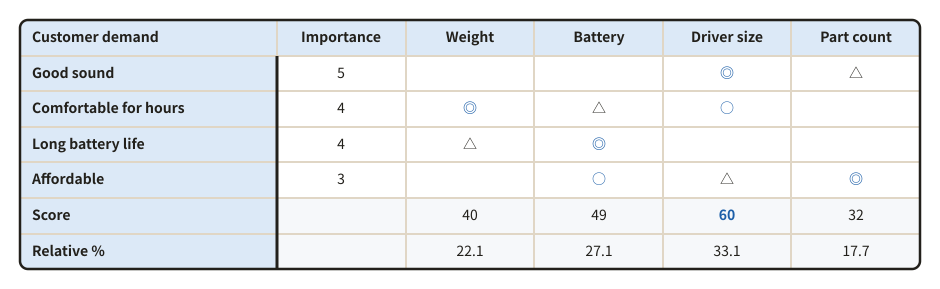
Histogram

Shows how measurements spread, as touching bars of counts per class. With the specification limits drawn, the classes outside them turn red.

Example of a histogram
Example prompt

Using svg-diagram, make a histogram of the outer diameters of 60 shafts. The specification is 9.95 to 10.05 mm; add the normal curve.

JSON (the figure as the tool receives it)
{
  "version": 1,
  "title": "Spread of shaft diameters",
  "parts": [
    {
      "type": "histogram",
      "lsl": 9.95,
      "usl": 10.05,
      "normal": true,
      "values": [
        9.98,
        10.02,
        10.01,
        9.97,
        10,
        10.03,
        9.99,
        10.01,
        10.04,
        9.96,
        10,
        10.02,
        9.98,
        10.01,
        10,
        9.99,
        10.05,
        10.01,
        9.97,
        10,
        10.02,
        9.99,
        10.03,
        10,
        9.98,
        10.01,
        10,
        10.06,
        9.99,
        10.02,
        10,
        9.95,
        10.01,
        10.03,
        9.98,
        10,
        10.02,
        9.99,
        10.01,
        10.04,
        10,
        9.97,
        10.02,
        10.01,
        9.99,
        10,
        10.03,
        9.98,
        10.01,
        10,
        9.99,
        10.02,
        10.07,
        10,
        9.98,
        10.01,
        10.03,
        9.99,
        10,
        10.02
      ]
    }
  ],
  "lang": "en"
}

Scatter diagram

Shows how two quantities relate, as a cloud of points. The regression line and the correlation coefficient r can be added.

Example of a scatter diagram
Example prompt

Using svg-diagram, draw a scatter diagram of temperature against defect rate, with the regression line and the correlation coefficient.

JSON (the figure as the tool receives it)
{
  "version": 1,
  "title": "Temperature and defect rate",
  "parts": [
    {
      "type": "scatter",
      "x": "Temperature (°C)",
      "y": "Defect rate (%)",
      "regression": true,
      "points": [
        {
          "x": 18,
          "y": 6.1
        },
        {
          "x": 19,
          "y": 6.4
        },
        {
          "x": 20,
          "y": 6
        },
        {
          "x": 21,
          "y": 6.9
        },
        {
          "x": 22,
          "y": 7.2
        },
        {
          "x": 23,
          "y": 7
        },
        {
          "x": 24,
          "y": 7.8
        },
        {
          "x": 25,
          "y": 8.1
        },
        {
          "x": 26,
          "y": 7.9
        },
        {
          "x": 27,
          "y": 8.6
        },
        {
          "x": 28,
          "y": 9
        },
        {
          "x": 29,
          "y": 8.8
        },
        {
          "x": 30,
          "y": 9.6
        },
        {
          "x": 31,
          "y": 9.9
        },
        {
          "x": 32,
          "y": 10.4
        }
      ]
    }
  ],
  "lang": "en"
}

Control chart

Shows whether a process is stable, with the values in time order and the control limits. Points outside the limits and runs of 7 are marked red.

Example of a control chart
Example prompt

Using svg-diagram, make a c chart of the defects found over 20 days, so I can see which days were out of control.

JSON (the figure as the tool receives it)
{
  "version": 1,
  "title": "Defects in the painting process (c chart)",
  "parts": [
    {
      "type": "controlChart",
      "chart": "c",
      "values": [
        3,
        5,
        4,
        2,
        6,
        4,
        3,
        5,
        4,
        3,
        7,
        4,
        5,
        3,
        13,
        4,
        5,
        6,
        4,
        3
      ],
      "xLabel": "Day",
      "yLabel": "Defects"
    }
  ],
  "lang": "en"
}

Risk analysis

Fault tree (FTA)

The event to prevent at the top, broken down through AND / OR gates into its causes, down to basic events (circles) and events not developed further (diamonds). The events that alone cause the top event (single points of failure) can be marked.

Example of a fault tree (fta)
Example prompt

Using svg-diagram, draw a fault tree of why our web service goes down. Split it into the database, the application and the network, and mark the single points of failure.

JSON (the figure as the tool receives it)
{
  "version": 1,
  "title": "Fault tree of a web service outage",
  "parts": [
    {
      "type": "faultTree",
      "cutSets": true,
      "maxNodeW": 160,
      "top": {
        "label": "The service goes down",
        "gate": "or",
        "children": [
          {
            "label": "The database stops",
            "gate": "and",
            "children": [
              {
                "label": "Primary fails",
                "kind": "basic"
              },
              {
                "label": "Failover fails",
                "kind": "basic"
              }
            ]
          },
          {
            "label": "All app servers stop",
            "gate": "or",
            "children": [
              {
                "label": "A faulty release",
                "kind": "basic"
              },
              {
                "label": "Out of memory",
                "kind": "basic"
              }
            ]
          },
          {
            "label": "The uplink is cut",
            "kind": "undeveloped"
          }
        ]
      }
    }
  ],
  "lang": "en"
}

Bow-tie diagram

The top event of a risk in the middle; its causes (threats) and the barriers that prevent it on the left, its consequences and the barriers that limit them on the right.

Example of a bow-tie diagram
Example prompt

Using svg-diagram, draw a bow-tie diagram of the risk of a personal data leak: the causes and how we prevent them, the consequences and how we limit them.

JSON (the figure as the tool receives it)
{
  "version": 1,
  "title": "Bow-tie of a personal data leak",
  "parts": [
    {
      "type": "bowtie",
      "hazard": "Customer data",
      "top": "Data leak",
      "threats": [
        {
          "label": "Intrusion",
          "barriers": [
            "MFA"
          ]
        },
        {
          "label": "Misdirected mail",
          "barriers": [
            "Address check"
          ]
        },
        {
          "label": "Lost laptop",
          "barriers": [
            "Disk encryption"
          ]
        }
      ],
      "consequences": [
        {
          "label": "Lost trust",
          "barriers": [
            "Prompt notice"
          ]
        },
        {
          "label": "Damages",
          "barriers": [
            "Cyber insurance"
          ]
        }
      ]
    }
  ],
  "lang": "en"
}

FMEA (failure mode and effects analysis)

For each part or step: how it fails, the effect, the cause and the action. RPN = severity x occurrence x detection is worked out and coloured.

Example of a fmea (failure mode and effects analysis)
Example prompt

Using svg-diagram, make an FMEA of a belt conveyor: the drive motor, the belt and the sensor, with the ratings after the actions too.

JSON (the figure as the tool receives it)
{
  "version": 1,
  "title": "FMEA of a belt conveyor",
  "parts": [
    {
      "type": "fmea",
      "sort": "rpn",
      "dense": true,
      "rows": [
        {
          "item": "Drive motor",
          "mode": "Overheats",
          "effect": "Line stops",
          "cause": "Clogged fan",
          "action": "Weekly cleaning",
          "s": 8,
          "o": 4,
          "d": 5,
          "after": {
            "s": 8,
            "o": 2,
            "d": 3
          }
        },
        {
          "item": "Belt",
          "mode": "Drifts",
          "effect": "Items fall off",
          "cause": "Low tension",
          "action": "Measure tension",
          "s": 6,
          "o": 5,
          "d": 4,
          "after": {
            "s": 6,
            "o": 2,
            "d": 2
          }
        },
        {
          "item": "Photo sensor",
          "mode": "False trigger",
          "effect": "Short stop",
          "cause": "Dirty lens",
          "action": "Clean more often",
          "s": 4,
          "o": 6,
          "d": 3,
          "after": {
            "s": 4,
            "o": 3,
            "d": 3
          }
        }
      ]
    }
  ],
  "lang": "en"
}

Designing quality

Quality function deployment (QFD)

Customer demands, each with its importance, against the quality characteristics of the product, marked ◎ ○ △ by how strongly they relate. Each characteristic gets a score and a share, so you see where to put the effort.

Example of a quality function deployment (qfd)
Example prompt

Using svg-diagram, make a QFD for wireless earbuds. Demands: sound, comfort, battery life, price. Characteristics: weight, battery capacity, driver size, part count.

JSON (the figure as the tool receives it)
{
  "version": 1,
  "title": "QFD for wireless earbuds",
  "parts": [
    {
      "type": "qfd",
      "demands": [
        {
          "label": "Good sound",
          "importance": 5
        },
        {
          "label": "Comfortable for hours",
          "importance": 4
        },
        {
          "label": "Long battery life",
          "importance": 4
        },
        {
          "label": "Affordable",
          "importance": 3
        }
      ],
      "characteristics": [
        "Weight",
        "Battery",
        "Driver size",
        "Part count"
      ],
      "relations": [
        [
          "",
          "",
          "◎",
          "△"
        ],
        [
          "◎",
          "△",
          "○",
          ""
        ],
        [
          "△",
          "◎",
          "",
          ""
        ],
        [
          "",
          "○",
          "△",
          "◎"
        ]
      ]
    }
  ],
  "lang": "en"
}